


 Is Netanyahu’s star waning in Washington? His latest meeting with Trump suggests it may be
  Tech Stock Positioning Nears Neutral as Investor Rotation Enters Final Phase, Deutsche Bank Says
  Gold Loses Momentum as Yields Rise and Safe-Haven Demand Fades
  Gold Spikes to $4085 on Fed Pause as Traders Eye Sell-the-Rally Setup
  Ukraine’s drone strikes are having an impact on Russia — but Russian leaders remain committed to war
  3 clinical-grade skincare creams you really shouldn’t buy online


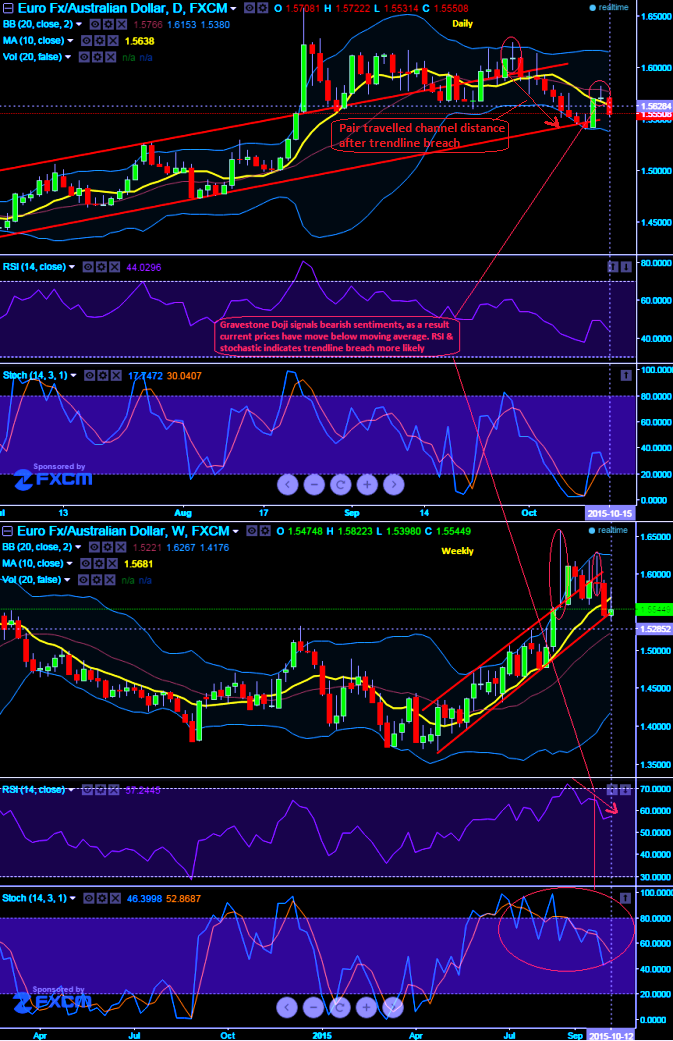
Our earlier targets of 1.5696 levels are achieved after the formation of last week's long real body bearish candle. But for now we again like to reiterate even though prices are showing strength today it is falling well below moving average curve.
More importantly we spotted out a gravestone pattern again at 1.5708, so we believe with this bearish indication the pair to either remain stagnant or drag towards 1.5475 levels if it breaks current levels of 1.5554 which is a trendline support. If it manages to hold these levels then it would bounce back again. But in our opinion it is better to use these rallies and stay calm with earlier ITM long puts instead of fresh long build ups.
RSI curve is currently trending at 44.6925 and an attempt of %D line crossover near 30 level (current %D is at around 30.9255 and %K is at 20.6366) on daily charts.
You can observe the pair has broken channel line support earlier at around 1.5917 levels previous to which it has formed spinning top as well and travelled the channel line distance but now inching towards little upwards slowly, while weekly leading oscillators puzzle by signaling bearish trend as they are converging downwards to the dropping prices.

- News

- Economy

- Central Banks
- Investing
- Research
- Roundups
- Digital Currency
- Insights
- Technical Analysis
- Technology
- Business
- Law
- Health
- Nature
- Fintech
- Science
- Topic
- Opinions
- ©Econometrics LLC . All Rights Reserved.
FxWirePro: Gravestone doji to evidence EUR/AUD’s further slumps – trendline breach likely
Thursday, October 15, 2015 8:50 AM UTC
Editor's Picks


- Market Data
Most Popular
1


