


 FxWirePro: Daily Commodity Tracker - 21st March, 2022


Here are some key charts based on data from United States’ Energy Information Agency’s (EIA) latest report that explains the level of inventories, refinery demand, and production.
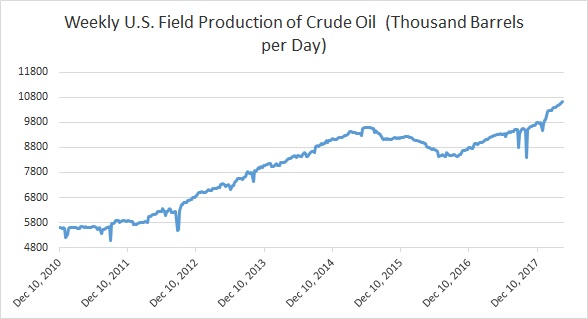
- Chart 1 shows crude oil production in the United States which has reached a new all-time high. It rose last week to 10.62 million barrels per day last week compared to 10.59 million barrels per day in the week before.
- Chart 2 shows the level of U.S. distillate inventories. After a steady decline since 2015, the inventories have started rising again since December last year. However, according to the latest report, the inventory declined to 118.83 million barrels.
- U.S. oil imports have been declining over the past couple of year. However, Chart 3 shows that imports rose sharply last week to 8.47 million barrels per day.
- Chart 4 shows the level of U.S. crude oil exports, which declined last week to 2.148 million barrels per day after reaching a new record high in the previous week to 2.331 million barrels per day.
- Chart 5 shows U.S. refinery operating at 91.1 percent capacity.
- Chart 6 shows the level of crude oil inventories, which has declined around 97 million barrels since March 2017. Inventories have risen last week to 435.95 million barrels.
FxWirePro launches Absolute Return Managed Program. For more details, visit http://www.fxwirepro.com/invest


