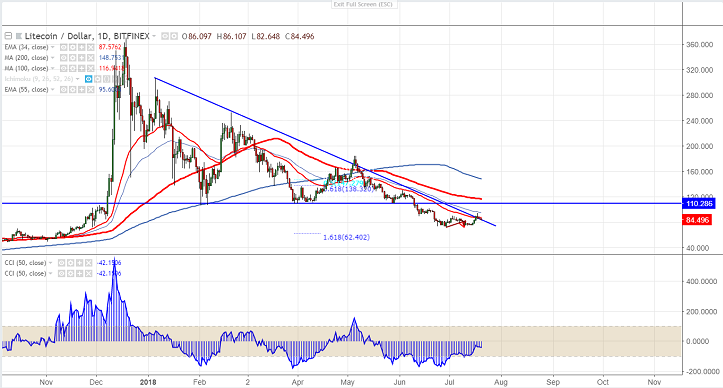
LTC/USD has declined more than $10 from the high of $94.45 made on Jul 18th 2018. The pair has broken major trend line resistance at $88 and this confirms minor trend reversal and a confirm jump till $103/$117 (100- day …
LTC/USD has declined more than $10 from the high of $94.45 made on Jul 18th 2018. The pair has broken major trend line resistance at $88 and this confirms minor trend reversal and a confirm jump till $103/$117 (100- day MA). The pair declined more than 50% from the temporary top $182.35. It is currently trading around $83.45. It has declined almost 79% from the all-time high of $370.
The near term solid resistance is around $96.55 (55- day EMA) and any break above will take the pair to next level till $103/$117.
On the lower side, any break below $83.50 (daily Kijun-sen) confirms minor weakness and a decline till $80/$73 is possible.
It is good to buy on dips around $84.50-85 with SL around $80 for the TP of $102.85/$117.