


 AUDJPY Volatile After Massive Sell-Off: Sell Rallies at 113, Targeting 110 as Bearish Momentum Surges
  FxWirePro: GBP/NZD remains weak, eyes 38.2%fib support
  US Magnificent 7 Stocks Trend Score: Amazon & Microsoft Hit Extreme Bullish (+100) as Meta Drops to -100 — Key Resistance & Support Watchlist
  FxWirePro: GBP/AUD bears maintain upper hand
  Major FX Action Bias & US Market Sentiment: NZD/USD (Extremely Bullish) & AUD/USD (Bullish) Watchlist
  FxWirePro- Major Pair levels and bias summary
  NZDJPY Retreats on Yen Strength – Bearish Setup Targets 90 After Hitting 92.75 Low
  FxWirePro: USD/CAD retreats after Canada posts stronger-than-expected GDP growth
  AUD/JPY Slips Below 112 as BOJ Intervention Sparks Bearish Momentum: Sell the Rallies
  FxWirePro- Major Crypto levels and bias summary
  FxWirePro: NZD/USD consolidates overnight gains, but loses momentum
  FxWirePro: USD/ZAR gains as stronger dollar outweighs upbeat South Africa's trade surplus
  FxWirePro: EUR/ AUD dips below 1.6400 level, focus on near term support
  FxWirePro:USD/JPY climbs back above 160.00 after BOJ rate decision
  FxWirePro- Woodies pivot (Major)
  FxWirePro: GBP/NZD remains weak, eyes 38.2%fib support


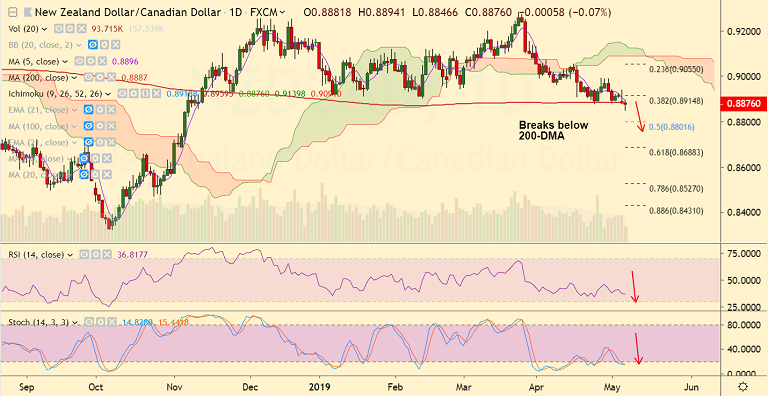
NZD/CAD chart - Trading View
Technical Analysis: Bias Bearish
- The pair has broken below 200-DMA, technical bias bearish
- GMMA indicator shows shift in trend, with shorter-term MAs crossing below longer-term MAs
- We see -ve DMI is dominant and rising in support of the downtrend
- Price action is below major moving averages and daily cloud
- Close below 200-DMA raises scope for dip till 61.8% Fib at 0.8688
- Retrace above 200-DMA could see test of 21-EMA at 0.8950. Break above 55-EMA negates bearish bias
Support levels - 0.8853 (Nov 12th 2018 low), 0.8801 (50% Fib), 0.8688 (61.8% Fib)
Resistance levels - 0.8897 (5-DMA), 0.8950 (21-EMA), 0.90 (55-EMA)
Recommendation: Stay short below 200-DMA, SL: 0.8950, TP: 0.88/ 0.8690
For more details on FxWirePro's Currency Strength Index, visit http://www.fxwirepro.com/currencyindex.

- News

- Economy

- Central Banks
- Investing
- Research
- Roundups
- Digital Currency
- Insights
- Technical Analysis
- Technology
- Business
- Law
- Health
- Nature
- Fintech
- Science
- Topic
- Opinions
- ©Econometrics LLC . All Rights Reserved.
FxWirePro: NZD/CAD Trade Idea
Tuesday, May 7, 2019 1:14 PM UTC
Editor's Picks


- Market Data
Most Popular


