
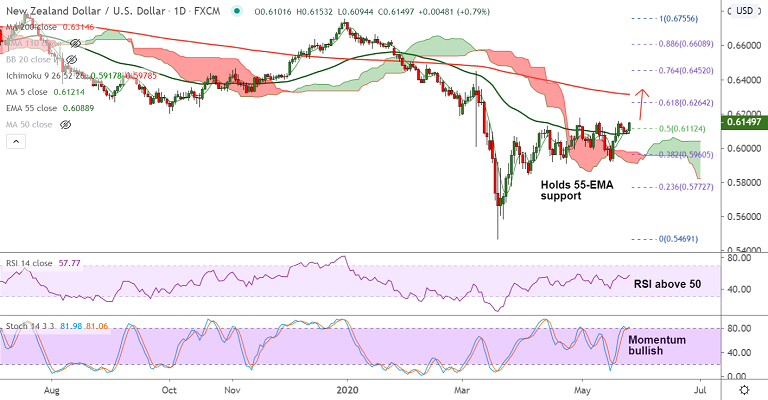
NZD/USD chart - Trading View
Technical Analysis: Bias Bullish
GMMA Indicator:
- Major Trend: Neutral
- Minor Trend: Bullish
Ichimoku Analysis:
- Price action in the pair is above daily cloud, Chikou Span indicates further upside
Oscillators:
- RSI is above 50 mark and is biased higher
- Stochs show bullish momentum, are approaching overbought levels, but no signs of reversal
Bollinger Bands:
- Bollinger Bands are wide and rising, volatility is high and could see substantial price movements
High/Low:
- Previous Week High/Low - 0.6157/ 0.5924
- Previous Session High/Low - 0.6108/ 0.6083
Major Support Levels: 0.6121 (5-DMA), 0.6088 (55-EMA), 0.6068 (21-EMA)
Major Resistance Levels: 0.6182 (110-EMA), 0.62, 0.6264 (61.8% Fib)
Summary: NZD/USD pullback has held support at 55-EMA and is extending bounce for the 2nd straight session. Rising volatility and bullish momentum will drive prices higher. 110-EMA is immediate hurdle at 0.6182. Break above 110-EMA will fuel further gains. Weakness only below 55-EMA.


