
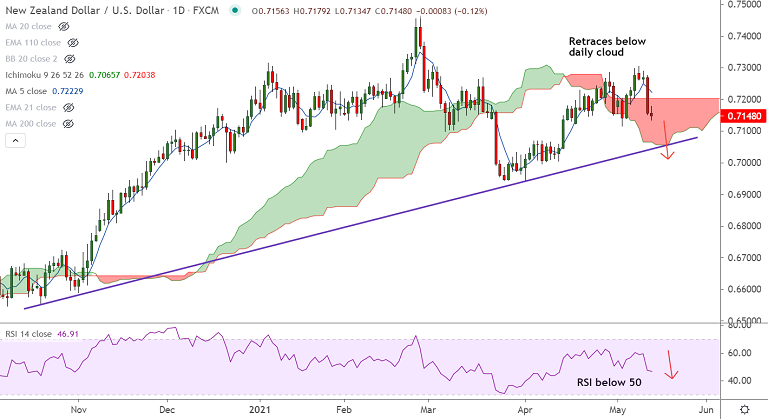
NZD/USD chart - Trading View
NZD/USD was trading largely unchanged at 0.7152 at around 11:40 GMT, bias bearish.
The pair is consolidating previous session's downside. Scope for further weakness.
Stochs and RSI are biased lower. RSI has slipped below 50 mark suggesting further downside.
MACD shows bearish crossover on signal line. Bearish divergence on RSI adds to the bearish bias.
On the daily charts, GMMA indicator shows major trend is neutral. Minor trend has turned bearish.
Price action has slipped below 200H MA. GMMA on the hourly charts shows major and minor trend are strongly bearish.
Price action has broken below 'Symmetric Triangle' pattern. Scope for dip till 23.6% Fib at 0.6993.
Focus for now remains on the release of the US Producer Price Index (PPI), and Initial Jobless Claims for further impetus.


