


 FxWirePro- Major Crypto levels and bias summary
  FxWirePro: GBP/AUD under pressure as pound continues to weaken
  Major Pair Action Bias: Bullish Pairs to Watch Out For
  FxWirePro: USD/ZAR uptrend loses steam, remains on bullish path
  FxWirePro- Woodies pivot (Major)
  FxWirePro- Major Pair levels and bias summary
  FxWirePro:USD/JPY hovers near a four-decade low
  AUDJPY Extends Four-Day Rally on Yen Weakness: Bullish Dip-Buy Eyes 117-118
  FxWirePro- Major Pair levels and bias summary
  FxWirePro: EUR/NZD downside pressure builds, key support level in focus
  JPY Action Bias: Bullish Pairs to Watch Out For
  FxWirePro- Woodies pivot (Major)
  FxWirePro: GBP/NZD downside pressure builds, key support levels in focus
  NZDJPY Action Bias: Bullish Dip-Buying Opportunity on Broad Yen Weakness
  FxWirePro: AUD/USD gains on Iran-US truce hopes, risk rally
  FxWirePro: USD/CAD positions for another climb, eyes 1.4150 level


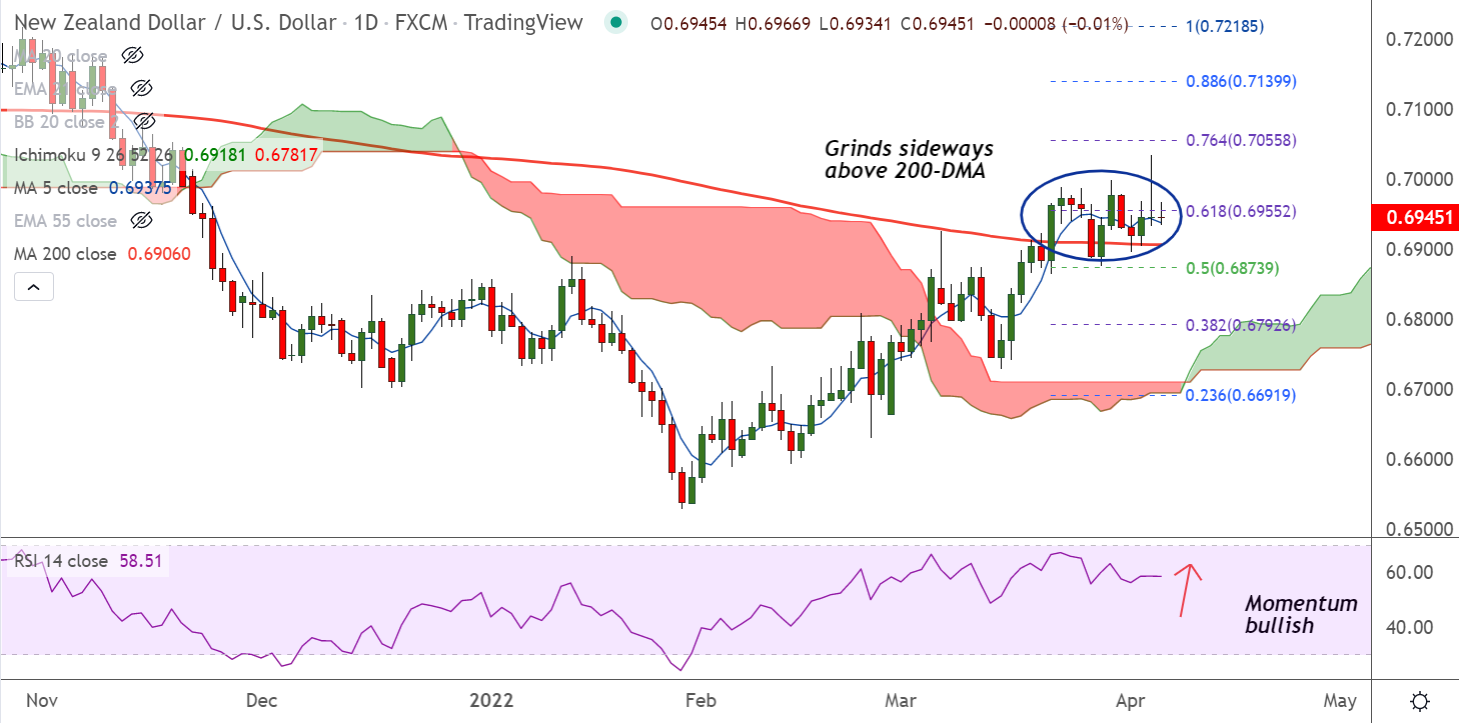
Chart - Courtesy Trading View
Technical Analysis: Bias Neutral
- NZD/USD was trading largely muted at 0.6947 at around 13:10 GMT
- The pair was rangebound on the day with session high at 0.6966 and low at 0.6934
- Price action capped below weekly cloud, the pair is capped below for the past 3 weeks
- 200H MA is immediate support at 0.6942, breach below will drag the pair lower
Support levels - 0.6942 (200H MA), 0.6906 (200-DMA), 0.6898 (21-EMA)
Resistance levels - 0.6955 (61.8% Fib), 0.70 (Weekly cloud), 0.7034 (Upper BB)
Summary: NZD/USD forms subsequent Doji formations on the daily candles denting upside. The pair is extending sideways above 200-DMA, retrace below will negate any further upside in the pair.


