


 FxWirePro: USD/ CNY remains soft ahead of Fed decision
  JPY Pairs Action Bias: EURJPY Leads as Bullish Standout Amid Mixed Momentum
  Major Forex Pairs Action Bias: GBPUSD and AUDUSD Turn Extremely Bearish
  NZDJPY Bullish Rebound: Buy Dips as EMAs Align for 97 Target
  FxWirePro: GBP/USD edges lower ahead of Fed policy verdict
  FxWirePro: GBP/NZD maintains bersish bias with focus on 2.2900 level
  EURUSD Spikes to 1.14306 on Fed Pause as Traders Eye Sell-the-Rally Setup
  Buy the Dips on EUR/JPY: Bullish Structure Points to 188 Target Ahead of Fed
  FxWirePro: GBP/AUD gains above 1.9200 level , upside pressure builds
  FxWirePro: NZD/USD firms as Kiwi gains on strong ANZ business outlook data
  FxWirePro- Major Pair levels and bias summary
  FxWirePro: AUD/USD falls after softer-than-expected Australian Q2 CPI
  NZD/JPY Flatlines Near 94.60: Will Key Support Reignite the Uptrend?
  AUD/JPY Slips Below 112 as BOJ Intervention Sparks Bearish Momentum: Sell the Rallies
  Major FX Action Bias & US Market Sentiment: NZD/USD (Extremely Bullish) & AUD/USD (Bullish) Watchlist
  FxWirePro: GBP/AUD gains some upside momentum but still bearish


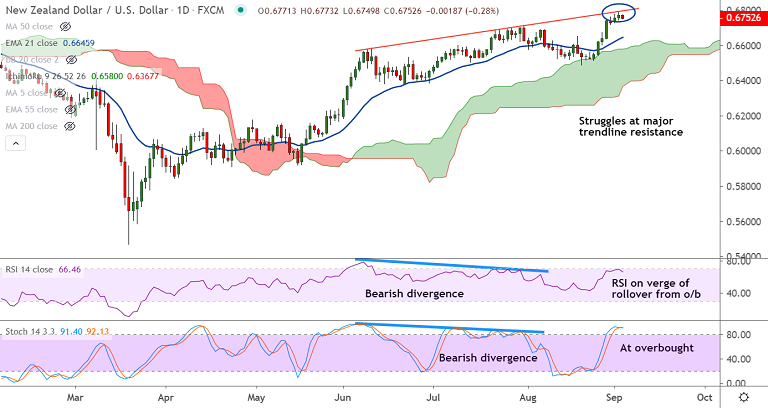
NZD/USD chart - Trading View
NZD/USD was trading 0.31% lower on the day at 0.6750 at around 05:25 GMT.
The major is showing retreat from 13-month highs at 0.6789 hit on Sept 2nd trade.
Oversold oscillators and bearish divergence may cause some pullbacks. Break below immediate support at 5-DMA to see further weakness.
Major trend is strongly bullish. Pullbacks are likely to bounce off support at 21-EMA or daily cloud.
Breach below cloud could change near-term dynamics. Bearish continuation below 200-DMA.
Stiff resistance is seen at 0.6789 (nearly converged trendline and 200W MA). Decisive break above will fuel further gains.
Support levels - 0.6726 (110H EMA), 0.6658 (200H MA), 0.6645 (21-EMA)
Resistance levels - 0.6760 (61.8% Fib), 0.6786 (200W MA), 0.68


