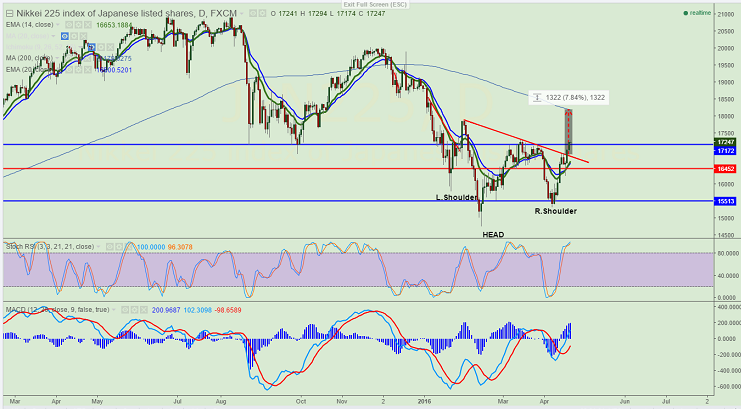
FxWirePro: Nikkei forms Inverse H&S pattern, good to buy at dips
Pattern Formed-Inverse Head and shoulder Major resistance - 17300 The index has broken neckline around 16800 and jumped till 17250 at the time of writing .It is currently trading around 17237.Short term trend is slightly…
The index has broken neckline around 16800 and jumped till 17250 at the time of writing .It is currently trading around 17237.Short term trend is slightly bullish as long as support 16500 (55 day 4H EMA) holds.
The index major resistance is around 17300 and any break above will take the index to next level 17600/17878 (29th Jan 2016)
On the lower side major support is around 16500 and break below will drag the index down till 16200(Daily Kijun-Sen)/16000/15800 (cloud top) in short term.
Short term weakness can be seen only below 15000.
It is good to buy at dips around 16900 with SL around 16500 for the TP of 17600/17878.