


 Aussie Ascent: AUDJPY Reclaims 110.00 as Bullish Momentum Ignites
  FxWirePro: AUD/USD recovers slightly from early decline but bears are not done yet
  FxWirePro: EUR/AUD eases as market awaits Iran deadline
  Euro Retreats as Geopolitical Tensions Surge: EURUSD Eyes 1.1400 Floor Amid Safe-Haven Demand
  FxWirePro: EUR/ NZD consolidating around 2.0180 room for further gains
  Ethereum Joins the Rally: ETH Reclaims USD 2,100 Following Bitcoin's Lead
  FxWirePro: EUR/AUD eases slightly but trend is still bullish
  FxWirePro: GBP/USD outlook weaker on renewed downside pressure
  Pound Under Pressure as Yen Stabilizes: GBPJPY Bears Target 208 as Key EMAs Hold Resistance
  FxWirePro: EUR/ NZD consolidating around 2.0200, room for further gains
  FxWirePro- Woodies Pivot(Major)
  FxWirePro: USD/ZAR sustains gains as uptrend remains strong
  FxWirePro- Major European Indices
  Ethereum Retreats Toward USD 2,000: Technicals Signal Caution as ETH Mimics Bitcoin’s Pullback


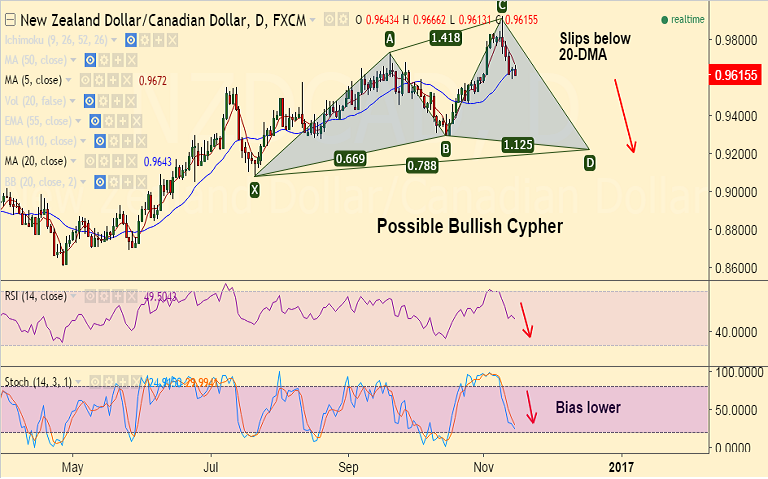
- Possible "Bullish Cypher" pattern formation seen on NZD/CAD daily charts.
- The pair has slipped below 20-DMA at 0.9643, intraday bias lower.
- Technical studies support downside, RSI and Stochs are biased lower.
- Major support levels - 0.96, 0.9568 (50-DMA), 0.95, 0.9460 (100-DMA & Sept 23 low)
- Major resistance levels - 0.9643 (20-DMA), 0.9673 (5-DMA), 0.97, 0.9735 (Sept 20 high)
Recommendation: Good to sell rallies around 0.9630, SL: 0.9675, TP: 0.96/ 0.9570/ 0.95
FxWirePro's Hourly NZD Spot Index was at -91.8942 (Bearish), while Hourly CAD Spot Index was at 53.1036 (Neutral) at 0536 GMT.
For more details on FxWirePro's Currency Strength Index, visit http://www.fxwirepro.com/currencyindex


