Home / Technicals / Article Technicals
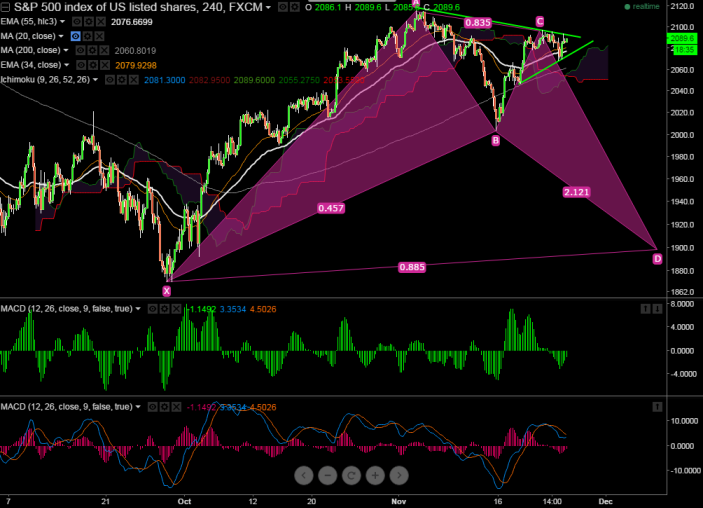
Add as a preferred source on Google FxWirePro: S&P 500 forms Bullish BAT Pattern, good to sell on rallies Harmonic Pattern formed - Bullish BAT pattern Potential Reversal Zone (PRZ) - 2120 The index made a low of 2068 and slightly recovered from that level. Overall trend is still bearish as long as resistance 2120 holds. On …
Updated Nov 25, 2015, 5:46 AM UTC 1 min read
Image from the original EconoTimes article Read the original article
Harmonic Pattern formed - Bullish BAT pattern
Potential Reversal Zone (PRZ) - 2120
The index made a low of 2068 and slightly recovered from that level. Overall trend is still bearish as long as resistance 2120 holds.
On the higher minor resistance is around 2104 and any break above targets 2110/2120 level.
The index support is around 2072 (trend line joining 2047 and 2069) and break below targets 2060 (200 day 4 HMA)/2045/2038.
It is good to sell on rallies around 2100-2105 with SL around 2120 for the TP of 2061/2045.
Technicals EURUSD - Levels to watch - 1.1100 GBPUSD Levels to watch - 1.3180 USDCHF Levels to watch - 0.8365 USDCAD - Levels to watch - 1.4300 AUDUSD - Levels to watch - 0.7000 NZDUSD - Levels to watch - 0.5560
By FxWirePro Team Oct 15, 2026, 3:20 AM UTC
Technicals EURUSD - Levels to watch - 1.100 GBPUSD Levels to watch - 1.3180 USDCHF Levels to watch - 0.8400 USDCAD - Levels to watch - 1.4300 AUDUSD - Levels to watch - 0.7000 NZDUSD - Levels to watch - 0.5560
By FxWirePro Team Oct 15, 2026, 3:17 AM UTC
Technicals JPY Major Pair Currency Score: USDJPY, GBPJPY and AUDJPY Extremely Bearish
By FxWirePro Team Oct 15, 2026, 2:34 AM UTC