Home / Technicals / Article Technicals
Add as a preferred source on Google S&P 500 forms Bearish Gartley pattern, good to sell on rallies Harmonic Pattern formed - Bearish Gartley PatternPotential reversal Zone (PRZ) - 2080 The index is facing resistance around 2080 and any break above will target 2100/2115 in short term. On the downside major support is a…
Image from the original EconoTimes article Read the original article
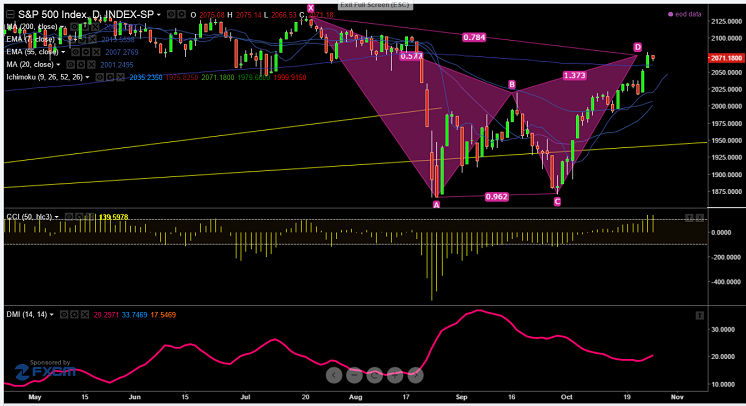
Harmonic Pattern formed - Bearish Gartley Pattern
The index is facing resistance around 2080 and any break above will target 2100/2115 in short term.
On the downside major support is around 2050 and break below targets 2035/2000/1975.
It is good to sell on rallies around 2075-80 with SL around 2105 with TP around 2035/2000/1980
Technicals EURUSD - Levels to watch - 1.1100 GBPUSD Levels to watch - 1.3180 USDCHF Levels to watch - 0.8365 USDCAD - Levels to watch - 1.4300 AUDUSD - Levels to watch - 0.7000 NZDUSD - Levels to watch - 0.5560
By FxWirePro Team Oct 15, 2026, 3:20 AM UTC
Technicals EURUSD - Levels to watch - 1.100 GBPUSD Levels to watch - 1.3180 USDCHF Levels to watch - 0.8400 USDCAD - Levels to watch - 1.4300 AUDUSD - Levels to watch - 0.7000 NZDUSD - Levels to watch - 0.5560
By FxWirePro Team Oct 15, 2026, 3:17 AM UTC
Technicals JPY Major Pair Currency Score: USDJPY, GBPJPY and AUDJPY Extremely Bearish
By FxWirePro Team Oct 15, 2026, 2:34 AM UTC