


 FxWirePro: USD/JPY edges higher as focus shifts to BOJ decision
  EURUSD Spikes to 1.14306 on Fed Pause as Traders Eye Sell-the-Rally Setup
  FxWirePro: GBP/USD edges lower ahead of Fed policy verdict
  FxWirePro- Major Pair levels and bias summary
  FxWirePro: USD/CAD slips after Fed holds rates steady
  FxWirePro- Major Pair levels and bias summary
  FxWirePro: EUR/AUD regains upwards momentum but unable to hold above 50%fib level
  NZDJPY Bullish Rebound: Buy Dips as EMAs Align for 97 Target
  FxWirePro: USD/ZAR firms ahead of Fed interest rate decision
  FxWirePro: GBP/USD rises as soft US data pressures dollar
  FxWirePro: NZD/USD firms as Kiwi gains on strong ANZ business outlook data
  Buy the Dips on EUR/JPY: Bullish Structure Points to 188 Target Ahead of Fed
  FxWirePro- Major Crypto levels and bias summary
  FxWirePro:EUR/NZD gains some upside momentum but still bearish
  FxWirePro:USD/JPY climbs back above 160.00 after BOJ rate decision
  FxWirePro: USD/ CNY hits one-month low,scope for futher downside


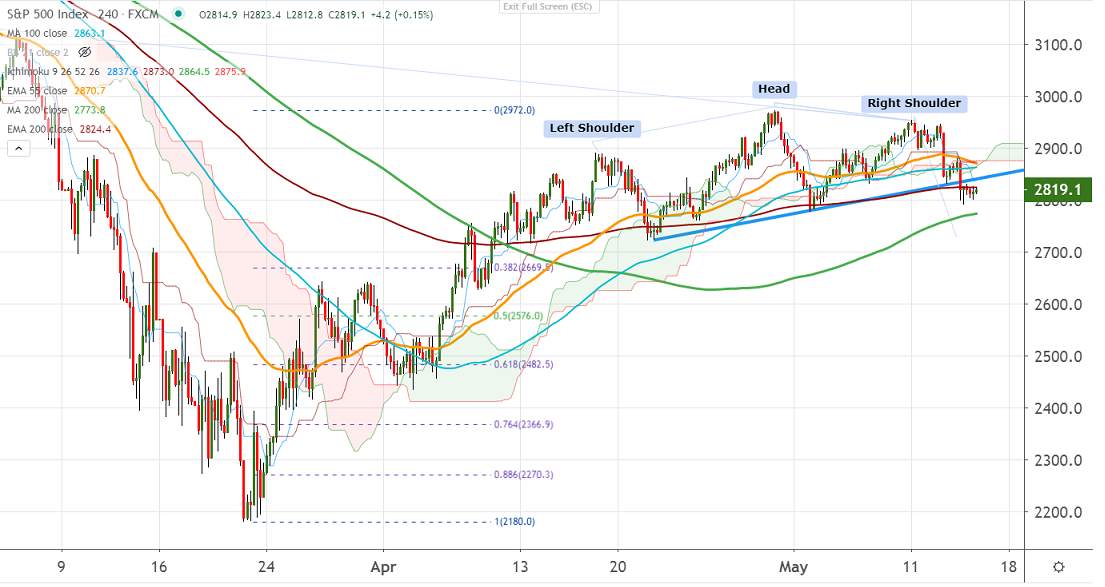
Chart pattern- Head and shoulder pattern
Ichimoku Analysis (4-Hour chart)
Tenken-Sen- 2866
Kijun-Sen- 2800
S&P500 is trading lower after a minor pullback till the 2953 level. The major trend remains on the downside as long as resistance 2972 holds. The index has formed a temporary top around 2972 and any trend continuation only above that level. It is currently trading around 2820.
On the flip side, immediate support is around 2800 and any break below will drag down till 2772 (200-4H MA) 2723 (Apr 23rd low)/2669 (38.2% fib).
The near-term resistance is at 2840, any indicative break above targets 2866/2900.
It is good to sell on rallies around 2850-55 with SL around 2900 for the TP of 2725.


