


 Euro Holds the Line: EURUSD Finds Support at the 365-EMA as Peace Talks Loom
  FxWirePro: USD/ZAR edges lower ,investors remain on edge
  Ethereum Consolidates: Bullish Technicals Point to a Potential $3,000 Breakout
  FxWirePro: EUR/CAD gains ground on prospects of resumed energy flows
  FxWirePro: EUR/AUD under pressure as key support gives way
  FxWirePro: GBP/NZD up trend gains some momentum but hurdles ahead
  Energy Surge Ignites US Inflation: USDCHF Eyes Support Amid Dollar Sell-Off
  FxWirePro:NZD/USD uptrend loses momentum but bullish setup remains
  FxWirePro- Major Crypto levels and bias summary
  FxWirePro- Major Pair levels and bias summary
  FxWirePro: USD/CAD recovers slightly but bearish outlook persists
  FxWirePro: AUD/USD retreats slightly but trend is still bullish
  FxWirePro: GBP/AUD positions for another drop, eyes 1.8900level
  FxWirePro: GBP/USD bulls remain cautiously optimistic
  FxWirePro: EUR/AUD downtrend loses steam but outlook still bearish


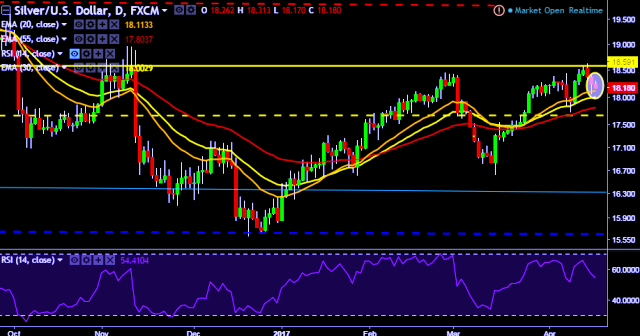
- XAG/USD is currently trading around $18.18 marks.
- It made intraday high at $18.31 and low at $18.18 levels.
- Intraday bias remains bearish till the time pair holds key resistance at $18.26 mark.
- A daily close above $18.26 will test key resistances at $18.42/$18.54/$18.63/$18.72 marks respectively.
- On the other side, a daily close below $18.26 will take the parity down towards key supports at $18.06/$17.89/$17.72/$17.51/$17.42/$17.22/$17.09/$16.87 marks respectively.
- Important to note here that 20D, 30D and 55D EMA heads up and confirms the bullish trend in a daily chart. Current downside movement is short term trend correction only.
We prefer to go short on XAG/USD around $18.20 with stop loss at $18.32 and target of $18.06/$17.89.


