


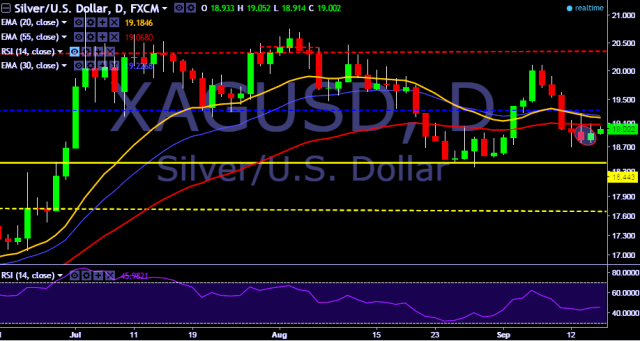
- XAG/USD is currently trading around $19.01 marks.
- It made intraday high at $19.05 and low at $18.91 levels.
- Intraday bias remains bullish till the time pair holds key support at $18.77 levels.
- A daily close below $18.77 will take the parity down towards key supports at $18.68, $18.44, $18.17, $17.69, $17.50 and $17.08 marks respectively.
- On the other side, a daily close above $19.10 will test key resistances at $19.27/$19.64/$19.75/$19.91/$20.10/$20.22/$20.32/$20.46/$20.67/$20.78/$21.09 and $21.46 marks respectively.
- Important to note here that in a daily chart 20D, 30D and 55D EMA heads up and confirms the bullish trend.
We prefer to go long on XAG/USD only above $19.10 with stop loss at $18.77 and target of $19.27/$19.64.


