


 FxWirePro- Major Crypto levels and bias summary
  FxWirePro: GBP/NZD range to extend until there is game changing news
  FxWirePro: EUR/AUD gaining momentum for a move towards 1.6800 level
  FxWirePro- Major Crypto levels and bias summary
  FxWirePro: USD/JPY firms as Trump's address on Gulf war spark fresh concerns
  FxWirePro- Major Pair levels and bias summary
  EUR/JPY Bulls Charge: Eyeing 186.00 as Euro Strength Intensifies
  FxWirePro: EUR/ NZD steadies around 2.0150, retains bid tone
  FxWirePro: EUR/AUD eases slightly but trend is still bullish
  FxWirePro: USD/CAD runs out of steam but maintains bullish outlook
  Bitcoin Battles Volatility: Institutional Support Eyes USD 64,000 Floor Amid Geopolitical Tensions
  Aussie Retreats Against the Yen: AUDJPY Bears Target 108 as 110 Resistance Holds Firm
  FxWirePro: EUR/ NZD consolidating around 2.0180 room for further gains
  NZDJPY Bears Take Control: New Zealand Dollar Retreats as 92 Resistance Holds Firm
  FxWirePro: USD/ZAR sustains gains as uptrend remains strong
  Ethereum Retreats Toward USD 2,000: Technicals Signal Caution as ETH Mimics Bitcoin’s Pullback
  FxWirePro- Woodies Pivot(Major)


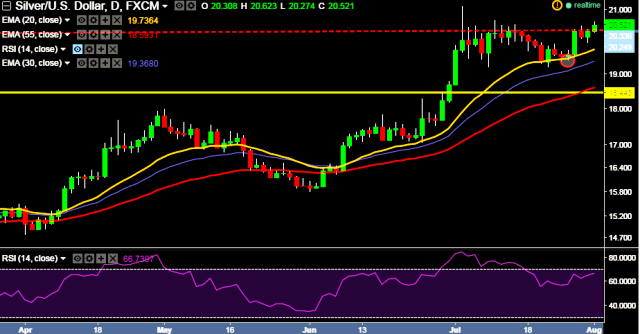
- XAG/USD is currently trading around $20.52 marks.
- It made intraday high at $20.62 and low at $20.27 levels.
- Intraday bias remains bullish till the time pair holds key support at $20.32 levels.
- A daily close above $20.62 will test key resistances at $20.78, $21.09 and $21.46 marks respectively.
- On the other side, a daily close below $20.32 will take the parity down towards key supports at $20.05, $19.88, $19.78, $19.41, $19.28, $19.17, 19.12, $19.09, $18.87 and $18.68 marks respectively.
- Important to note here that in a daily chart, 20D, 30D and 55D EMA heads up and confirms the bullish trend in a daily chart.
We prefer to take long position in XAG/USD around $20.48 with stop loss at $20.32 and target of $20.78/$20.95.


