


 FxWirePro- Major Crypto levels and bias summary
  FxWirePro: EUR/ NZD steadies around 2.0150, retains bid tone
  FxWirePro- Woodies Pivot(Major)
  FxWirePro: USD/CNY gains some ground but bearish outlook persists
  FxWirePro: EUR/ NZD loses momentum but outlook is bullish
  AUDJPY Pullback Intensifies: Resistance at 110.00 Signals Short Opportunity
  FxWirePro: EUR/AUD gaining momentum for a move towards 1.6800 level
  NZDJPY Technical Outlook: Bearish Bias Deepens as Key Resistances Hold
  FxWirePro: GBP/USD recovers but bears are not done yet again
  AUDJPY Pullback Intensifies: Resistance at 110.00 Signals Short Opportunity
  FxWirePro: GBP/NZD range to extend until there is game changing news
  Ethereum Rises on Geopolitical De-escalation: Pezeshkian’s Peace Signal Ignites Bullish Momentum
  FxWirePro: USD/JPY neutral in the near-term, scope for downward resumption
  FxWirePro: USD/ZAR fibo rejection triggers sizeable pullback
  FxWirePro: USD/JPY firms as Trump's address on Gulf war spark fresh concerns


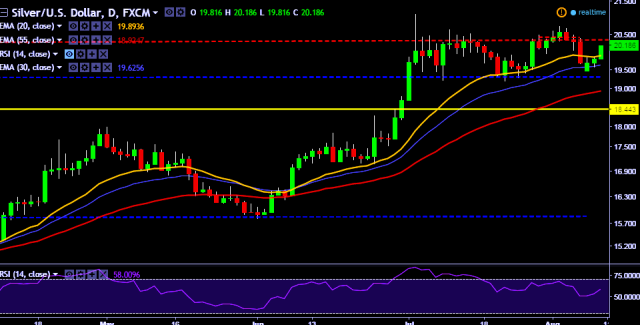
- XAG/USD is currently trading around $20.19 marks.
- It made intraday high at $20.20 and low at $19.81 levels.
- Intraday bias remains bullish till the time pair holds key support at $19.88 levels.
- A daily close below $19.88 will take the parity down towards key supports at $19.68, $19.46, $19.17, 19.12, $19.09, $18.87 and $18.68 marks respectively.
- On the other side, a daily close above $20.05 will test key resistances at $20.32/$20.45/$20.67/$20.78/$21.09 and $21.46 marks respectively.
- Important to note here that in a daily chart 20D, 30D and 55D EMA heads up and confirms the bullish trend.
We prefer to take long position in XAG/USD around $20.12 with stop loss at $19.88 and target of $20.32/$20.66.


