


 FxWirePro: GBP/AUD under pressure as pound continues to weaken
  FxWirePro- Major Pair levels and bias summary
  FxWirePro: GBP/NZD gains some ground but bias is still bearish
  GBPJPY Slips After Sterling Weakness, Bears Eye 216
  FxWirePro- Major Crypto levels and bias summary
  FxWirePro : USD/JPY holds relatively bid on 163 ahead Of FOMC,BoJ meetings
  FxWirePro: EUR/NZD downside pressure builds, key support level in focus
  NZDJPY Action Bias: Bullish Dip-Buying Opportunity on Broad Yen Weakness
  FxWirePro: NZD/USD edges lower, remains on back foot
  FxWirePro- Woodies pivot (Major)
  AUDJPY Action Bias: Bullish Dip-Buy Setup Despite Flat Neutral Bias
  FxWirePro: GBP/AUD downside pressure builds, key support level in focus
  FxWirePro- Major Crypto levels and bias summary
  FxWirePro: GBP/USD downtrend loses steam but outlook still bearish
  FxWirePro: EUR/AUD outlook weaker on renewed downside pressure
  FxWirePro: USD/CAD gaining momentum for a move towards 1.4200 level


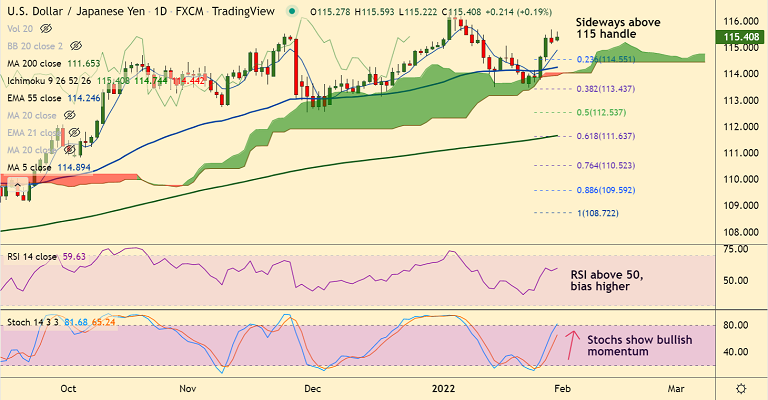
Chart - Courtesy Trading View
Technical Analysis:
GMMA Indicator
- GMMA indicator shows major and minor trend are bullish
- Scope for bullish continuation
Ichimoku Analysis
- Price action is extending bounce off daily cloud support
- Chikou span is biased higher, scope for further upside
Oscillators
- Stochs and RSI are biased higher, RSI is well above the 50 mark
- Momentum is with the bulls
Bollinger Bands
- Bollinger bands are spread wide apart
- Shows volatility is high and could carry the bullish momentum
Major Support Levels: 114.89 (5-DMA), 114.66 (21-EMA), 114.38 (200H MA)
Major Resistance Levels: 116, 116.13 (Upper W BB), 116.66 (88.6% Fib)
Summary: USD/JPY was trading with a bullish bias. Scope for upside resumption. Bullish invalidation only below daily cloud.


