


 FxWirePro- Major Pair levels and bias summary
  FxWirePro: GBP/AUD bears maintain upper hand
  FxWirePro: GBP/NZD remains weak, eyes 38.2%fib support
  FxWirePro:USD/JPY climbs back above 160.00 after BOJ rate decision
  Nikkei Surges Past 65,000 on Suspected Yen Weakness: Tech Giants Like Advantest and NEC Lead Explosive Gains
  FxWirePro- Woodies pivot (Major)
  Major FX Action Bias & US Market Sentiment: NZD/USD (Extremely Bullish) & AUD/USD (Bullish) Watchlist
  FxWirePro: USD/CAD retreats after Canada posts stronger-than-expected GDP growth
  FxWirePro- Major Crypto levels and bias summary
  FxWirePro: USD/ZAR gains as stronger dollar outweighs upbeat South Africa's trade surplus
  FxWirePro: AUD/USD gains some ground but outlook is bearish
  FxWirePro- Woodies pivot (Major)
  AUDJPY Volatile After Massive Sell-Off: Sell Rallies at 113, Targeting 110 as Bearish Momentum Surges
  NZDJPY Retreats on Yen Strength – Bearish Setup Targets 90 After Hitting 92.75 Low
  FxWirePro: NZD/USD consolidates overnight gains, but loses momentum
  Major European Indices Score Extremely Bullish: DAX Eyes 26000, CAC Targets 8600, FTSE100 at 11000 – Key Levels to Watch


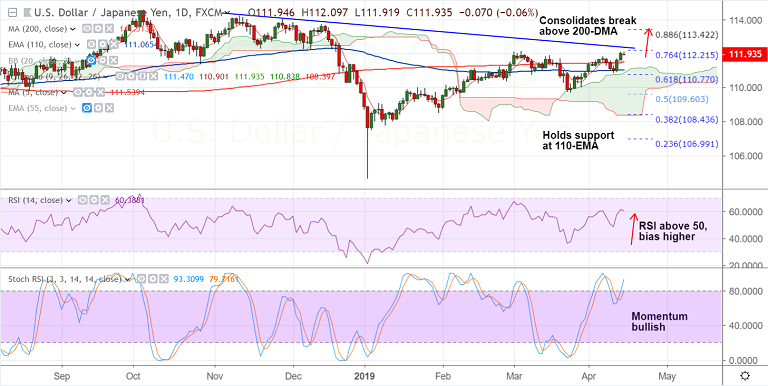
USD/JPY chart - Trading View
USD/JPY Daily Technical Analysis: Bias Bullish
- Price action consolidates break above 200-DMA
- Stochs and RSI show bullish momentum
- Cloud offers strong support, weakness only on break below
- Upside struggles at 112 handle, break above will see further upside
- On the weekly charts 200W SMA is offering strong resistance
- Technical indicators on the weekly charts are also bullish. Price has broken above weekly cloud
- Scope for gains upto 88.6% Fib at 113.42. Weakness likely below 111 handle
Support levels - 111.51 (nearly converged 5 and 200-DMA), 111 (nearly converged 110-EMA and 20-DMA), 110.83 (Apr 15 low)
Resistance levels - 111.95 (200-W SMA), 112.21 (76.4% Fib), 113, 113.42 (88.6% Fib)
For details on FxWirePro's Currency Strength Index, visit http://www.fxwirepro.com/currencyindex.

- News

- Economy

- Central Banks
- Investing
- Research
- Roundups
- Digital Currency
- Insights
- Technical Analysis
- Technology
- Business
- Law
- Health
- Nature
- Fintech
- Science
- Topic
- Opinions
- ©Econometrics LLC . All Rights Reserved.
FxWirePro: USD/JPY Daily Technical Analysis
Monday, April 15, 2019 4:34 AM UTC
Editor's Picks


- Market Data
Most Popular


