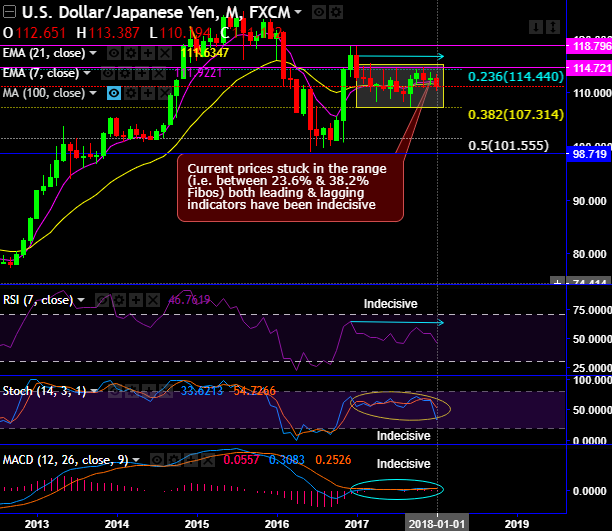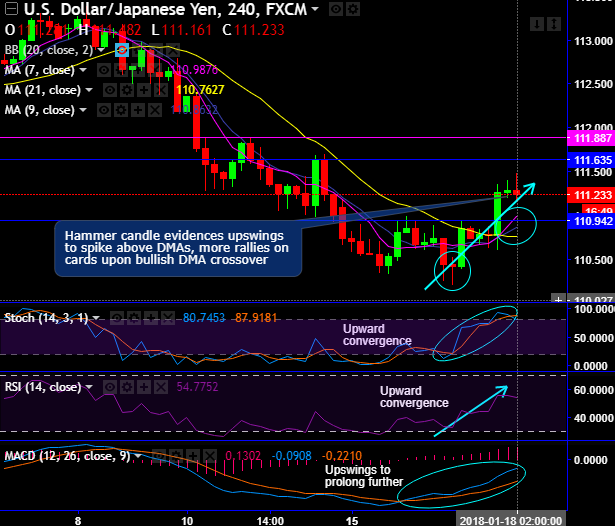
Chart pattern: USDJPY forms the long lasting range of monthly plotting and hammer pattern candle that is bullish in nature to signal more rallies in the days to come. Observe current upswings spike above DMAs with bullish crossover.
Stiff resistance zone is observed at 111.635 to 111.887 areas, we’ve seen the failure swings at this juncture couple of times in the recent past.
Both RSI & stochastic curves are converging upwards to signal the strength and intensified bullish momentum on daily terms and slightly indecisive on monthly but selling pressures are observed on this timeframe.
While same has been the case with trend indicators, DMAs on daily terms indicate uptrend to prolong further, whereas EMAs have been indecisive on monthly terms
MACD indicates upswings to prolong further in minor trend, the same has also been indecisive in the major trend.
Well, overall, one could trust the indications given by the leading & lagging indicators on daily terms coupled with bullish candlestick formation and bid for further rallies upto next stiff resistance.
While the major trend still stuck between 23.6% and 38.2% Fibonacci retracement levels (refer monthly plotting), the trend on this timeframe shows failure swings exactly at 23.6% Fibonacci levels couple of times in the recent times. On the flip side, it has tested strong supports at or around 38.2% levels. In this oscillation, the pair is hovering on EMAs (refer monthly plotting).
Trading tips: Contemplating above technical rationale, we advocate buying one touch binary call options to participate in the ongoing rallies, this strategy is likely to add magnifying effects to the yields as spot FX keeps flying until expiration.
Since bearish momentum in major trend are intensified, at spot reference: 111.289, contemplating lingering bearish indications, on hedging grounds we recommend shorting near-month month futures as the underlying spot FX likely to target southwards 109 levels in the medium run.
Writers in a futures contract are expected to maintain margins in order to open and maintain a short futures position.
Currency Strength Index: FxWirePro's hourly USD spot index has shown -41 (which is bearish), while hourly JPY spot index was at -148 (highly bearish) while articulating at 07:21 GMT. For more details on the index, please refer below weblink:
http://www.fxwirepro.com/currencyindex.
FxWirePro launches Absolute Return Managed Program. For more details, visit: