


 FxWirePro- Major European Indices
  FxWirePro- Woodies Pivot(Major)
  NZDJPY Bearish Breakdown: Why Selling the Rallies is the Strategic Play
  GBPJPY Surges to 211.88: Sterling Bulls Target 215 Amid Broad-Based Buying
  FxWirePro- Major Pair levels and bias summary
  FxWirePro: USD/CNY drifts lower, vulnerable to more downside
  FxWirePro- Major European Indices
  FxWirePro- Major Crypto levels and bias summary
  Kiwi Under Pressure: NZDJPY Signals Bearish Turn as Resistance at 92.00 Holds Firm
  FxWirePro:NZD/USD remains vulnerable as Trump's latest deadline leaves investors on edge
  Bitcoin Resilience: BTC Reclaims USD 69,000 as Geopolitical Tensions Ease
  FxWirePro: USD/JPY holds range near 160 as intervention risks loom
  FxWirePro: EUR/AUD eases slightly but trend is still bullish
  FxWirePro: AUD/USD recovers slightly from early decline but bears are not done yet
  FxWirePro: GBP/NZD remains buoyant, looks to extend gains


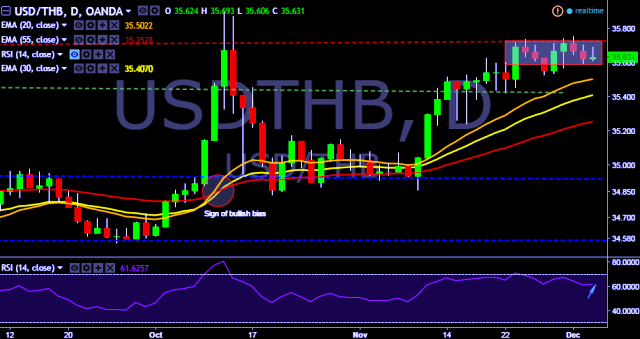
- USD/THB is currently trading around 35.63 marks.
- It made intraday high at 35.69 and low at 35.60 marks.
- Intraday bias remains neutral till the time pair holds key resistance at 35.70 marks.
- On the top side key resistances are seen at 35.70, 35.90, 36.05, 36.44 and 36.66 marks respectively.
- Alternatively, a daily close below 35.58 will drag the parity down towards key supports around 35.41, 35.23, 35.04, 34.83, 34.64, 34.51 and 34.20 marks respectively.
- Important to note here that 20D, 30D and 55D EMA heads up and confirms the bullish trend in a daily chart.
We prefer to take long position in USD/THB only above 35.70, stop loss at 35.58 and target of 35.90.


