


 FxWirePro- Major Crypto levels and bias summary
  FxWirePro: USD/CAD extends decline on broad dollar weakness
  FxWirePro- Major European Indices
  FxWirePro- Major Pair levels and bias summary
  Bitcoin’s Volatile Reset: ETFs Rebound as Bulls Eye USD 80,000 Milestone
  FxWirePro- Woodies Pivot(Major)
  FxWirePro: EUR/CAD gains ground on prospects of resumed energy flows
  FxWirePro: USD/JPY holding bid into weekend
  Energy Surge Ignites US Inflation: USDCHF Eyes Support Amid Dollar Sell-Off
  FxWirePro: USD/ZAR edges lower ,investors remain on edge
  FxWirePro: USD/CNY neutral in the near-term, scope for downward resumption
  FxWirePro- Major Pair levels and bias summary
  FxWirePro: USD/CAD recovers slightly but bearish outlook persists
  FxWirePro: GBP/USD bulls remain cautiously optimistic
  FxWirePro: AUD/USD retreats slightly but trend is still bullish
  FxWirePro: GBP/NZD up trend gains some momentum but hurdles ahead


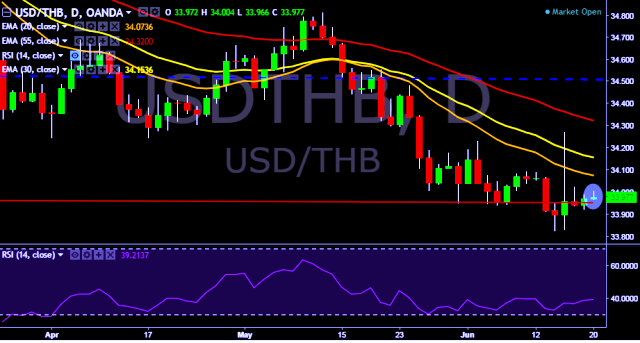
- USD/THB is currently trading around 33.97 marks.
- It made intraday high at 34.00 and low at 33.96 marks.
- Intraday bias remains neutral for the moment.
- On the top side, key resistances are seen at 34.02, 34.27, 34.34, 34.48, 34.55, 34.67, 34.74, 34.82, 34.97, 35.11 and 35.20 marks respectively.
- Alternatively, a daily close below 33.97 will drag the parity down towards key supports around 33.90, 33.82, 33.74, 33.58, 33.01 and 32.54 marks respectively.
- Important to note here that 20D, 30D and 55D EMA heads down and confirms the bearish trend in a daily chart.
We prefer to take long position in USD/THB only above 34.02, stop loss 33.90 and target of 34.27.


