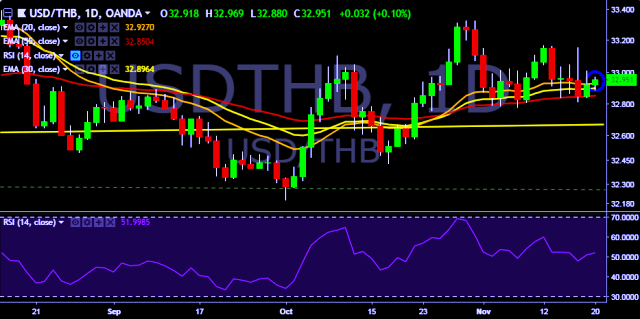
- USD/THB is currently trading around 32.95 marks.
- It made intraday high at 32.96 and low at 32.88 marks.
- Intraday bias remains slightly bullish for the moment.
- On the top side, key resistances are seen at 33.02, 33.15, 33.32, 33.52, 33.78 and 33.96 marks respectively.
- Alternatively, a daily close below 32.91 will drag the parity down towards key supports around 32.77, 32.68, 32.57, 32.42, 32.20 and 32.07 marks respectively.
- Important to note here that 20D, 30D and 55D EMA heads up and confirms the bullish trend in a daily chart.
We prefer to take long position on USD/THB only above 33.02, stop loss 32.87 and target of 33.15.


FxWirePro- Woodies pivot (Major)
EUR/JPY Under Pressure: Broad Yen Buying Keeps Bears in Control Below 183.00
FxWirePro- Major Pair levels and bias summary
FxWirePro- Major Crypto levels and bias summary
FxWirePro: GBP/AUD bears maintain upper hand
Forex Scorecard: EUR/USD, GBP/USD, and NZD/USD Stand Out as Prime Bullish Opportunities
FxWirePro: EUR/ AUD dips below 1.6400 level, focus on near term support
FxWirePro- Major Pair levels and bias summary
NZDJPY Retreats on Yen Strength – Bearish Setup Targets 90 After Hitting 92.75 Low
FxWirePro: USD/ZAR gains as stronger dollar outweighs upbeat South Africa's trade surplus
All Major JPY Pairs Hit Extreme Bearish Score of -100: USDJPY, EURJPY, GBPJPY, AUDJPY, NZDJPY & CADJPY Flash Maximum Weakness
FxWirePro: USD/CNY downtrend loses steam, remains on bearish path
Gold Retreats as Geopolitical Fears Ease: Bears Target $4,000 Support
FxWirePro: USD/ZAR gains as weak SA Manufacturing data hits rand 



