Technicals

Add as a preferred source on Google

FxWirePro: USDCAD forms hammer pattern, good to buy on dips

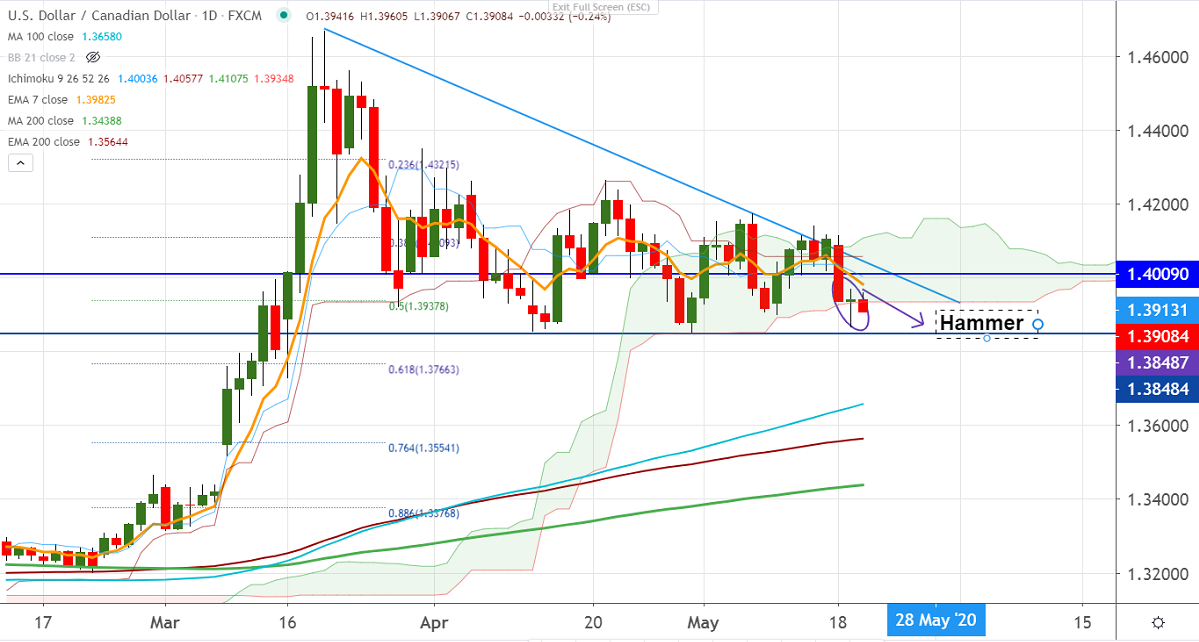
Chart pattern-Hammer Ichimoku Analysis (Daily chart) Tenken-Sen- 1.40197 Kijun-Sen- 1.40577 USDCAD has recovered slightly after hitting a low of 1.38660. The pair has formed a double bottom around 1.38500 and major weakn…

1 min read
FxWirePro: USDCAD forms hammer pattern, good to buy on dips
Image from the original EconoTimes article

Read the original article

Chart pattern-Hammer


Ichimoku Analysis (Daily chart)


Tenken-Sen- 1.40197


Kijun-Sen- 1.40577


USDCAD has recovered slightly after hitting a low of 1.38660. The pair has formed a double bottom around 1.38500 and major weakness only below that level. WTI crude oil is holding above $32 after the API report shows an inventory draw of 4.8 million vs. a forecast of the build of 1.15 million barrels.


Markets eye Canada CPI for further direction. Technically, significant support stands at 1.3850, and any violation below targets 1.3800/1.3760. The near term resistance is at 1.3960, an indicative break above will take the pair to next level till 1.4000/1.4060.


It is good to buy on dips around 1.3885 with SL around 1.3845 for the TP of 1.4000.

Related articles

View all
Technicals

Major Pair Currency Score: AUDUSD Bearish

EURUSD - Levels to watch - 1.100 GBPUSD Levels to watch - 1.3180 USDCHF Levels to watch - 0.8400 USDCAD - Levels to watch - 1.4300 AUDUSD - Levels to watch - 0.7000 NZDUSD - Levels to watch - 0.5560

