


 Michael Burry Shorts Tesla at $416 as AI and Semiconductor Bearish Bets Expand
  Goldman Sachs Says China Competition Weighs More on EU Growth Than Trade Deficit
  State of emergency in Crimea as Ukraine focuses pressure on ‘jewel in Putin’s crown’
  Trump has made more than $1 billion from crypto in a year. How?
  Despite its best efforts, Iran won’t be able to toll the Strait of Hormuz. Here’s why
  Morgan Stanley Names BAE Systems Top European Defence Stock Despite Lower Price Target
  Economic pessimism has set in – but there are reasons for Australians to be hopeful
  In a rebuke to Trump, the Supreme Court rules that birthright citizenship is the law of the land


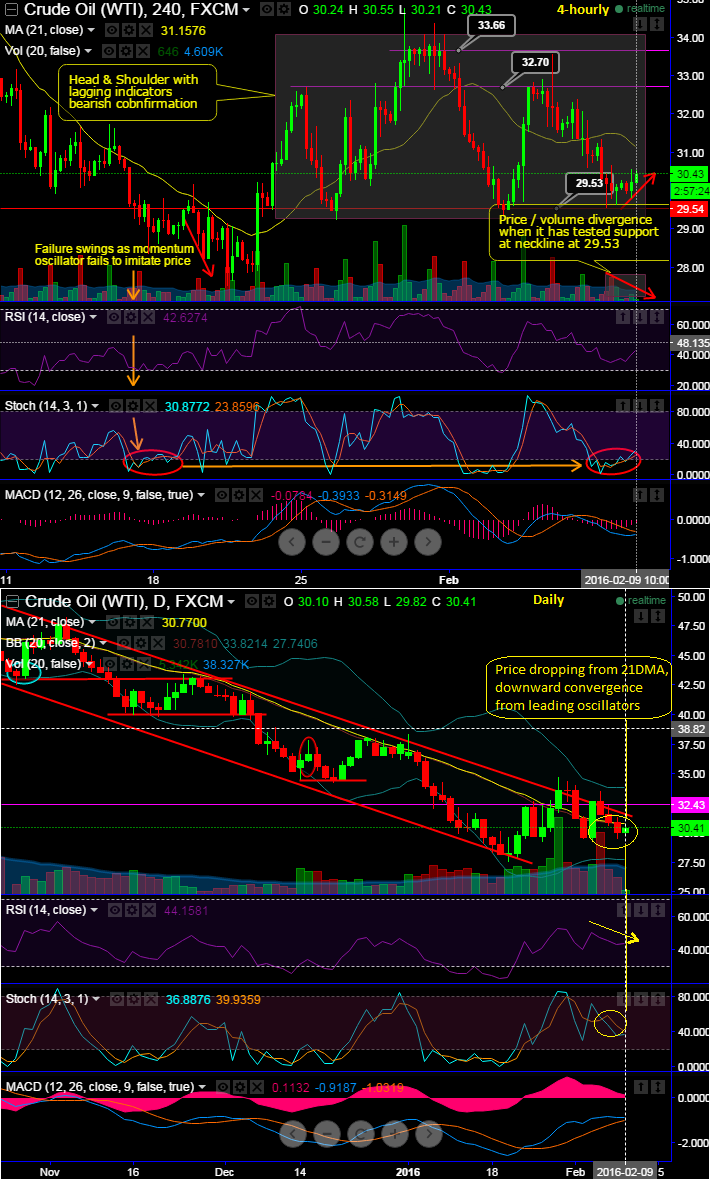
Price curve has been moving "Head and shoulder pattern" but has tested the neckline support at 29.53 levels. H&S with peak at 33.78 and right shoulder at 32.72 and left shoulder at 32.50.
Although it seems like this commodity has shown a little strength, the day highs of 30.58 has been rejected which is near 21DMA.
In other terms, it is almost 21DMA crossing over 7DMA that is again interpreted to be bearish trend to prevail, so it is sell.
Most significantly, the minor spikes in intraday prices are not in conformity to the volumes (see grey shaded areas on volume histograms). These shrinking volumes with minor price rises may burn hasty bulls undoubtedly.
While on the daily price observation, it is clear downward convergence to the ongoing declining rallies, since it has recently rejected channel resistance we would expect more dips assured by both leading and lagging indicators.
We believe, despite these strong bearish indications in the robust bearish trend if we find any abrupt upswings are subject to fundamental news that would be absolutely out of the blue.
So we haven't reconsidered our bearish stance on the WTI crude oil price as it is most unlikely to move anywhere above 35 in near future and instead, think it would move back below 30/barrel shortly to head towards our recent targets at the magic number of $25 a barrel.

- News

- Economy

- Central Banks
- Investing
- Research
- Roundups
- Digital Currency
- Insights
- Technical Analysis
- Technology
- Business
- Law
- Health
- Nature
- Fintech
- Science
- Topic
- Opinions
- ©Econometrics LLC . All Rights Reserved.
FxWirePro: WTI crude tests support at neckline of head and shoulder, trend indicators signal downtrend to prolong
Tuesday, February 9, 2016 11:48 AM UTC
Editor's Picks


- Market Data
Most Popular


6


