


 JPY Currency Meter Signals: NZDJPY Bullish (+25) vs CHFJPY (-100) – These Pairs Could Move Next
  FxWirePro- Woodies pivot (Major)
  FxWirePro: GBP/AUD drifts lower after BOE rate decision
  FxWirePro: AUD/USD gains some ground but outlook is bearish
  FxWirePro: USD/ZAR gains as stronger dollar outweighs upbeat South Africa's trade surplus
  FxWirePro- Major Crypto levels and bias summary
  AUDJPY Volatile After Massive Sell-Off: Sell Rallies at 113, Targeting 110 as Bearish Momentum Surges
  FxWirePro- Woodies pivot (Major)
  FxWirePro: GBP/AUD bears maintain upper hand
  Major FX Action Bias & US Market Sentiment: NZD/USD (Extremely Bullish) & AUD/USD (Bullish) Watchlist
  FxWirePro: NZD/USD consolidates overnight gains, but loses momentum
  Major European Indices Score Extremely Bullish: DAX Eyes 26000, CAC Targets 8600, FTSE100 at 11000 – Key Levels to Watch
  FxWirePro: EUR/ AUD dips below 1.6400 level, focus on near term support
  NZDJPY Bullish Rebound: Buy Dips as EMAs Align for 97 Target
  FxWirePro: GBP/NZD remains weak, eyes 38.2%fib support
  FxWirePro- Major Pair levels and bias summary


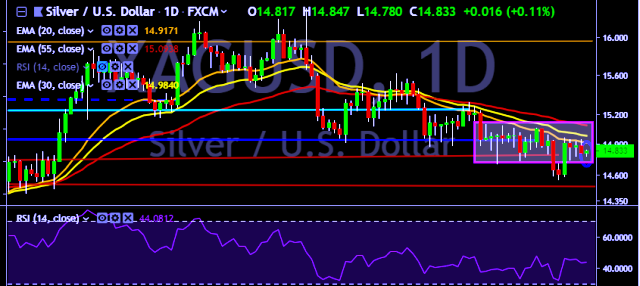
- XAG/USD is currently trading around $14.81 marks.
- It made intraday high at $14.84 and low at $14.78 levels.
- Intraday bias remains neutral for the moment.
- A daily close above $14.89 will test key resistances at $14.97, $15.09, $15.22, $15.32 and $15.40 marks respectively.
- On the other side, a daily close below $14.81 will take the parity down towards key supports at $14.70, $14.52, $14.40 and $14.28 marks respectively.
- Important to note here that 20D, 30D and 55D EMA heads down and confirms the bearish trend in a daily chart.
We prefer to take long position on XAG/USD only above $14.85, stop loss at $14.72 and target of $14.97/$15.09.


