


 FxWirePro- Major Crypto levels and bias summary
  US Magnificent 7 Stocks Trend Score: Amazon & Microsoft Hit Extreme Bullish (+100) as Meta Drops to -100 — Key Resistance & Support Watchlist
  FxWirePro: GBP/AUD bears maintain upper hand
  FxWirePro: EUR/ AUD dips below 1.6400 level, focus on near term support
  Nikkei Surges Past 65,000 on Suspected Yen Weakness: Tech Giants Like Advantest and NEC Lead Explosive Gains
  FxWirePro- Woodies pivot (Major)
  FxWirePro- Major Pair levels and bias summary
  AUD/JPY Slips Below 112 as BOJ Intervention Sparks Bearish Momentum: Sell the Rallies
  NZDJPY Bullish Rebound: Buy Dips as EMAs Align for 97 Target
  AUDJPY Volatile After Massive Sell-Off: Sell Rallies at 113, Targeting 110 as Bearish Momentum Surges
  NZDJPY Retreats on Yen Strength – Bearish Setup Targets 90 After Hitting 92.75 Low
  FxWirePro: AUD/USD gains some ground but outlook is bearish
  FxWirePro- Major Pair levels and bias summary
  Major FX Action Bias & US Market Sentiment: NZD/USD (Extremely Bullish) & AUD/USD (Bullish) Watchlist
  FxWirePro- Major Crypto levels and bias summary
  FxWirePro: GBP/NZD remains weak, eyes 38.2%fib support


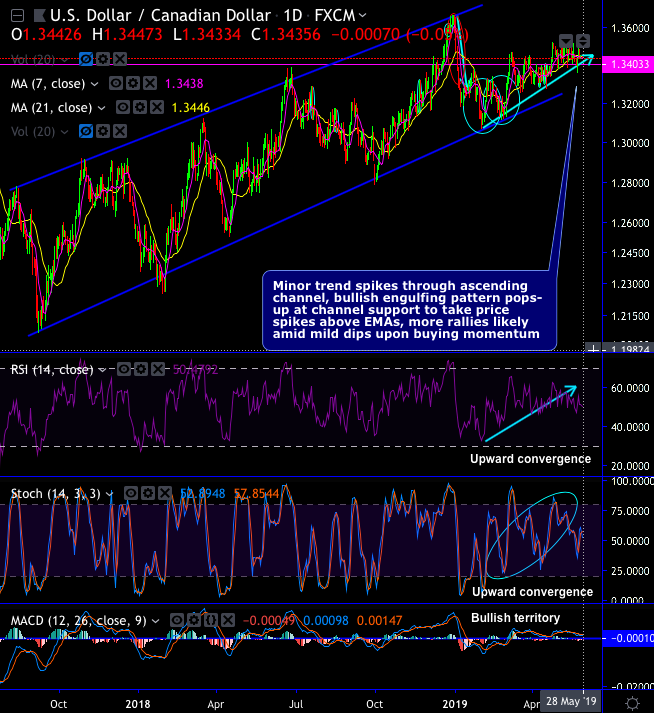
In this write-up, we attempt to establish a USDCAD bullish trade setup contemplating technical charting and candlestick patterns coupled with some important indicators.
USDCAD formed hammer and bullish engulfing candles on both daily and monthly terms.
Hammer and Bullish Engulfing candles have been traced out at 1.3341 and 1.3421 levels respectively (on daily plotting) that has also signaled strength in upswings of this pair.
These patterns have occurred at 1.2463 and 1.2828 levels on monthly terms also.
Most importantly, these bullish patterns have developed the ascending channel pattern in the minor trend. The pair has tested channel support at 1.3112 levels, consequently, the current price has spiked well above DMAs with bullish crossovers. Similarly, it has tested uptrend support at 1.2782 levels to spike above EMAs on monthly terms.
While both leading oscillators (RSI and Stochastic curves) show upward convergence to indicate the strength in the uptrend and the intensified buying momentum.
To substantiate this buying sentiment, bullish DMA & MACD crossovers also indicate the upswings to prolong further.
Hence, the prevailing uptrend is most likely to prolong further up to the next stiff resistance of 1.3638 levels.
Trade Tips: One daily trading grounds, at spot reference: 1.3435 levels, we advocate executing double-touch call options strategy with a view of participating in the prevailing rallies, use upper strikes at 1.3519 levels, that means the strategy for 75-85 pips is likely to fetch leveraged yields as long as the underlying price keeps spiking towards upper strikes on the expiration.
Alternatively, contemplating above technical rationale on a broader perspective, we advocated initiating longs in USDCAD futures contracts of May’19 delivery for the major uptrend. We now continue to uphold the same strategy by rolling over with June deliveries ahead of BoC’s monetary policy that is scheduled for this week.
Currency Strength Index: FxWirePro's hourly CAD spot index is flashing at -28 (which is mildly bearish), while hourly USD spot index was at -107 (bearish) while articulating at 06:01 GMT.
For more details on the index, please refer below weblink: http://www.fxwirepro.com/currencyindex


