


 GBPUSD, AUDUSD & NZDUSD Turn Extremely Bullish: Strong Positive Momentum Drives Major Pair Action Bias
  NZDJPY Bullish Surge: Strong Kiwi Ignites Fresh Upside as 94 Support Holds and All EMAs Align
  FxWirePro: EUR/AUD outlook weaker on renewed downside pressure
  FxWirePro- Major Pair levels and bias summary
  AUDJPY Bullish Surge: Strong Australian Dollar Fuels Fresh Upside as Pair Holds Above 113.50 and All EMAs Align
  JPY Action Bias: Extremely Bullish Surge Ignites Across NZD, GBP & AUD
  FxWirePro- Woodies pivot (Major)
  FxWirePro: GBP/NZD gains some upside momentum but still bearish
  FxWirePro: USD/JPY uptrend loses steam, remains on bullish path
  FxWirePro: GBP/USD hits one-month high, scope for further upside
  EUR/USD Holds Bullish Tone Despite Pullback from Yesterday’s High
  AUDJPY Extremely Bullish Above 113: Strong AUD Fuels Fresh Rally – Buy Dips at 113 Targeting 115
  FxWirePro: NZD/USD steadies around 0.5830,retains bid tone
  FxWirePro: NZD/USD trades in narrow range ,outlook bullish
  ETH Stands Alone Bullish; BTC, SOL, XRP, BNB Neutral


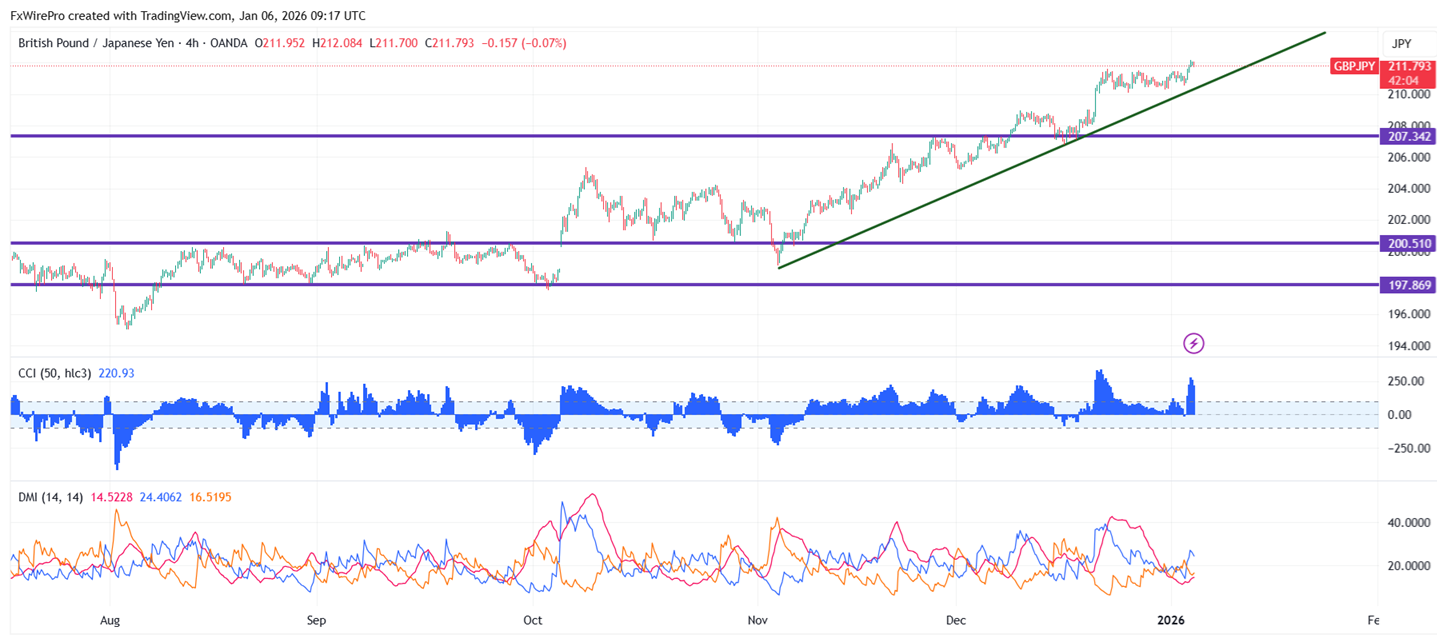
GBPJPY breaks significant resistance at 212 after a long consolidation. As long as support 210 holds, the intraday trend is bullish. It is trading around 211.88, as of publication, and has reached an intraday high of 212.15.
Oscillators and moving averages to forecast the trend of GBPJPY
CMP- 211.86
EMA (4- hour chart)
55-EMA- 211.38
200-EMA- 210.78
365-EMA- 210.03. The pair trades above the short-term (55-EMA) and long-term moving averages (365 EMA and below 200 EMA).
Major Support- 211.35. Any breach below this level will drag the pair down to 210.50/209.70/208.60/207.95/207.20/206.75.
Major resistance - 212.20. Any break above confirms minor bullishness; a jump to 212.60/213/214 is possible.
Indicator (4-hour chart)
CCI (50)- Bullish
Average directional movement Index- Neutral. All indicators confirm a neutral trend.
It is good to buy on dips around 211 with SL around 210 for a TP of 213/214.


