


 FxWirePro: USD/CNY attracts selling interest, vulnerable to more downside
  JPY Strength Alert: USDJPY, AUDJPY, EURJPY and CADJPY Turn Extremely Bullish
  FxWirePro: USD/CAD retreats slightly but trend is still bullish
  FxWirePro:NZD/USD edges higher as kiwi firms on hawkish RBNZ outlook
  Major Crypto Action Bias: ETHUSD Turns Bullish – Only Bullish Pair to Watch
  AUDJPY Extends Four-Day Rally as Yen Weakness Fuels Fresh Buying Opportunity
  FxWirePro: AUD/USD bulls struggles as upside momentum fades
  FxWirePro:USD/JPY hovers near 40-year peak,intervention fears linger
  FxWirePro:USD/JPY holds above 163 as intervention fears keep traders on edge
  AUDJPY Pulls Back on Profit Booking: Buy Dips Toward 117/118
  NZDJPY Dips Create Fresh Buy Opportunity as Key Support Holds
  FxWirePro: USD/CNY gains some upside momentum but bias still bearish
  FxWirePro: GBP/NZD gains some upside momentum but still bearish
  FxWirePro: AUD/USD rallies on jobs surge, heads to test key resistance
  FxWirePro: GBP/AUD downtrend loses steam but outlook still bearish


 - EconoTimes)


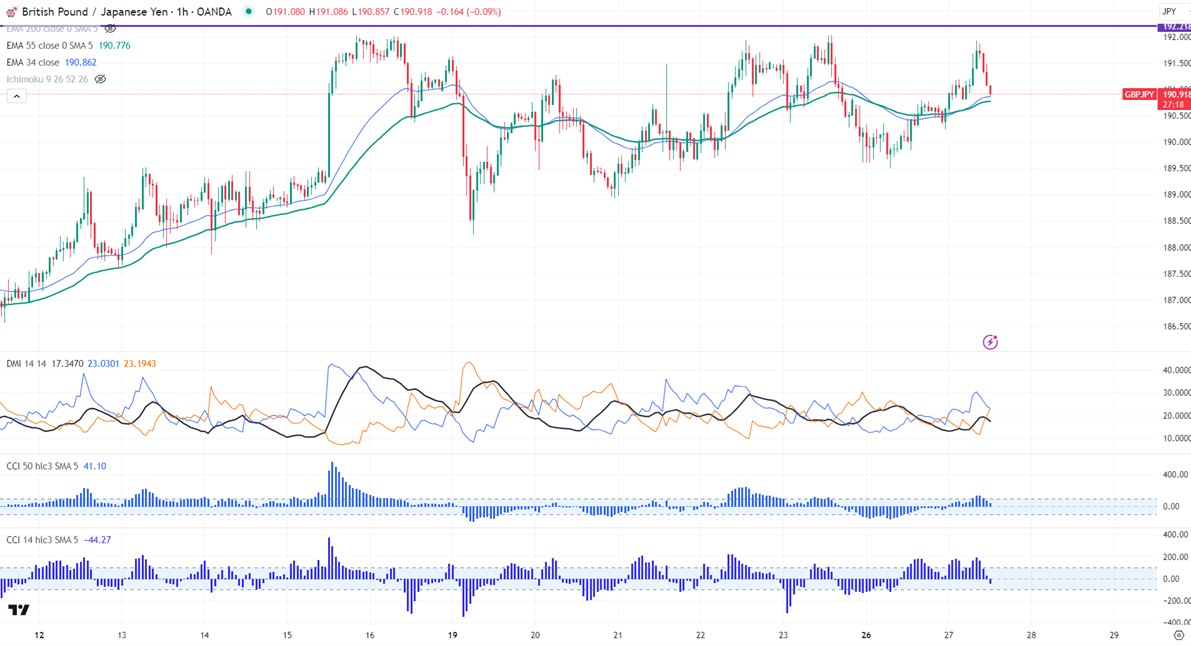
Chart pattern- Triple top around 192.
GBPJPY pared most of its gains made during the Asian session. It hit a high of 191.92 and is currently trading around 191.15.
Technicals-
The pair is trading above 34- and 55 EMA in the hourly chart.
The near-term resistance is around 191.20, a breach above targets 191.50/192. Major trend continuation only above 192.05. The immediate support is at 190.85 (34- H EMA), any violation below will drag the pair to 190.75 /190.50/190/189.48/188.90.
The pair should close below 190.75-85 for further weakness.
Indicator (hourly chart)
CCI (14)- Bearish
CCI (50)- Bullish (below 100)
Average directional movement Index - Neutral. All indicators confirm the mixed trend.
It is good to sell below 190.75 with SL around 191.20 for a TP of 189.51.


