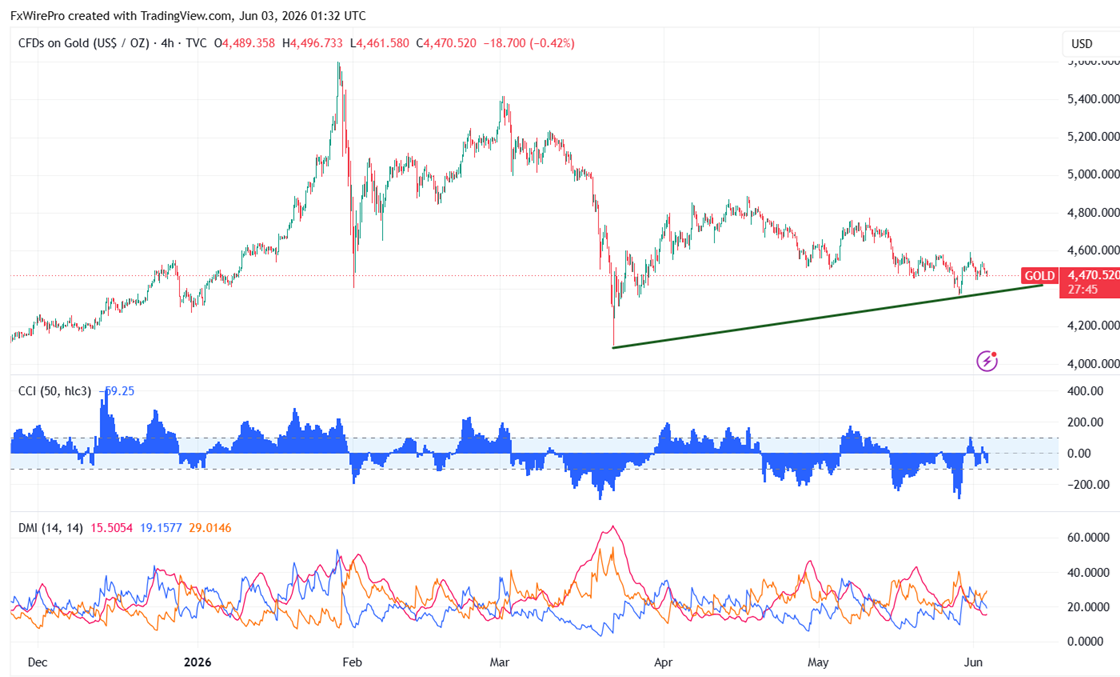
As of June 3, 2026, gold has fallen below $4,500 per ounce, giving back recent record gains as stalled U.S.–Iran peace negotiations rekindled worries about long Middle East conflict and persistent inflation. Energy costs rising on high oil prices have caused markets to give up hope for Federal Reserve rate decreases this year—Chair Powell even hinted at possible hikes—and bond yields have gone up, and the dollar index is up nearly 2% since the conflict started. Investors have liquidated holdings and sent the precious metal down as a result of a stronger dollar, growing opportunity costs for non-yielding bullion, and regular profit-taking following several all-time highs.
|
Technicals |
CMP -$4474 |
Trend |
|
|
4- Hour chart |
Value |
|
|
|
55 EMA |
$4511 |
CMP < 55 EMA |
Bearish |
|
200- EMA |
$4601 |
CMP < 200- EMA |
Bearish |
|
365- EMA |
$4651 |
CMP < 365 EMA |
Bearish |
Major support-$4400/$4350/$4000. Major bearishness below $4000. Any violation below targets $3605/$3000/$2800.
|
Momentum indicator (4-hour chart) |
Inference |
Value |
|
CCI(50) |
Bearish |
-40.94 |
|
ADX |
neutral |
Strength increased from 19.57 to 22.47 |
It is good to sell on rallies around $4498-500 with SL around $4600 for a TP of $4000/$3600.