
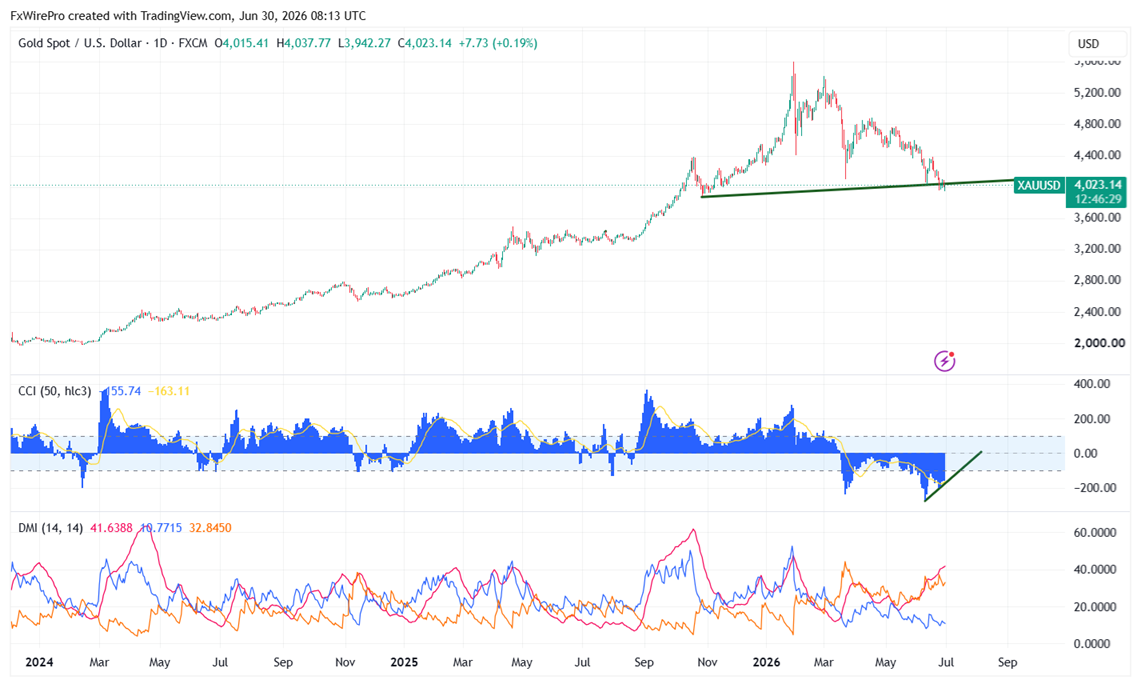
Though gold has shown false breakdown below 365 -D EMA, it has never closed below these level for the last five days. It reached an intraday low of $3942 and now it's around $4014.50.
|
Technicals 15-min |
CMP -$4033 |
Trend |
|
|
4- Hour chart |
Value |
|
|
|
55 EMA |
$4416 |
CMP <55 EMA |
Bearish |
|
200- EMA |
$4350 |
CMP <200- EMA |
Bearish |
|
365- EMA |
$3986 |
CMP > 365 EMA |
Bullish |
Major support-$3980. Major bearishness below $3940. Any violation below targets $3880/$3800/$3600. Near-term resistance - $4080/$4095/$4136/$4200/$4245/$4300/$4400.
|
Momentum indicator (4-hour chart) |
Inference |
Value |
|
CCI(50) |
Bearish |
-155.51 (Hidden divergence) |
|
ADX |
Bearish |
Strength increased from 32 to 40.93 |
It is good to buy on dips around $3985-86, with an SL around $3940, for a TP of $4136/$4150.


