


 Goldman Sachs Says China Competition Weighs More on EU Growth Than Trade Deficit
  Gold Surges Past $4150 on Dovish Fed Signals and Weak Jobs Data; Bullish Outlook Prevails
  Morgan Stanley Names Marks & Spencer Top European Retail Pick, Sees Strong Upside
  Goldman Sachs Raises USD/JPY Forecast, Sees Yen Weakness Persist Through 2027
  Gold Pulls Back After Hitting $4,180 as Geopolitical Risk Sends Crude Higher
  US Inflation Expected to Ease in June, but Fed Rate Hike Risks Persist Amid Middle East Tensions
  JPMorgan Cuts Gold Price Forecast, Sees Bullion Reaching $4,500 by End of 2026


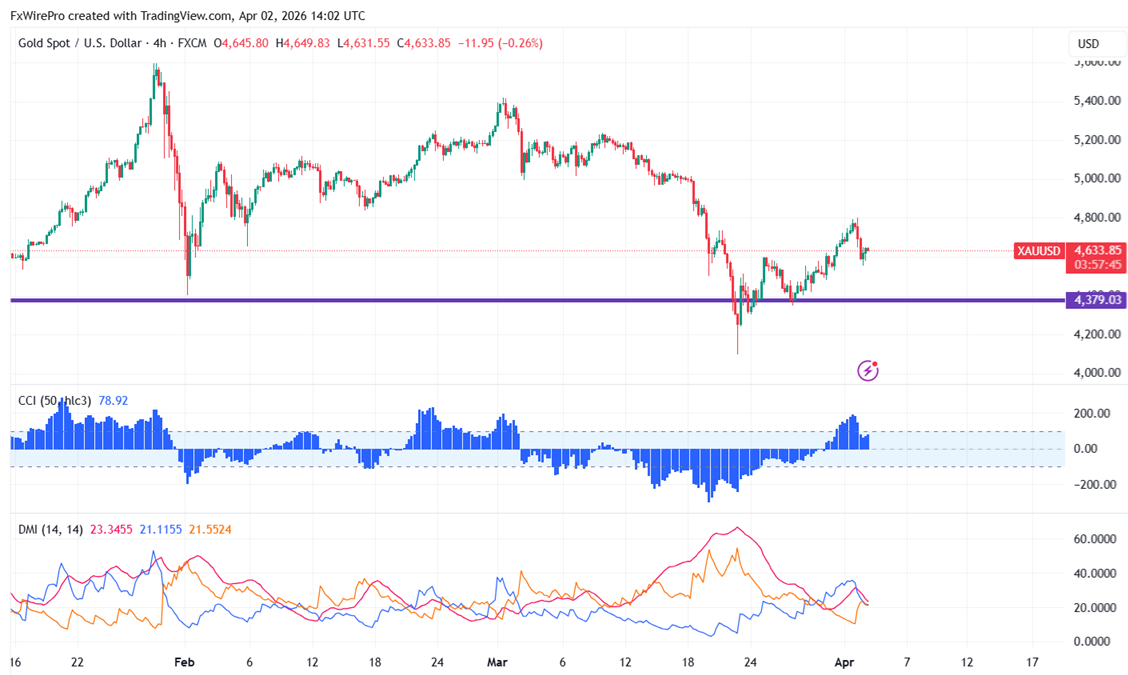
Gold struggles to break above 200- 4H EMA and pared most of its gains as crude oil price surge. After hitting a peak around $4800 yesterday, it’s currently hovering near $4589.
|
Technicals |
CMP -$4589 |
Trend |
|
|
4- Hour chart |
Value |
|
|
|
55 EMA |
$4621 |
CMP < 55 EMA |
Bearish |
|
200- EMA |
$4804 |
CMP < 200- EMA |
Bearish |
|
365- EMA |
$4775 |
CMP < 365 EMA |
Bearish |
Major support- $4530/$4500/$4400/$4000. Major bearishness below $4000. Any violation below targets $3605/$3000/$2800.
|
Momentum indicator (4-hour chart) |
Inference |
Value |
|
CCI(50) |
Bullish |
-110.86 |
|
ADX |
neutral |
Strength increased from 39 to 44 |
It is good to sell on rallies around $4628-30 with SL around $4800 for a TP of $4000/$3600.


