LTC/USD targets 4.05, further upside only above 100-day MA
LTC/USD hit a fresh high of 4.05 levels on Thursday, but failed to hold its strength. It is currently trading at 3.96 levels (BTC-e). Short-term trend: Bullish Long-term trend: Bullish Ichimoku analysis of daily chart: T…
By Shampa Mani
Updated 1 min read
Image from the original EconoTimes article
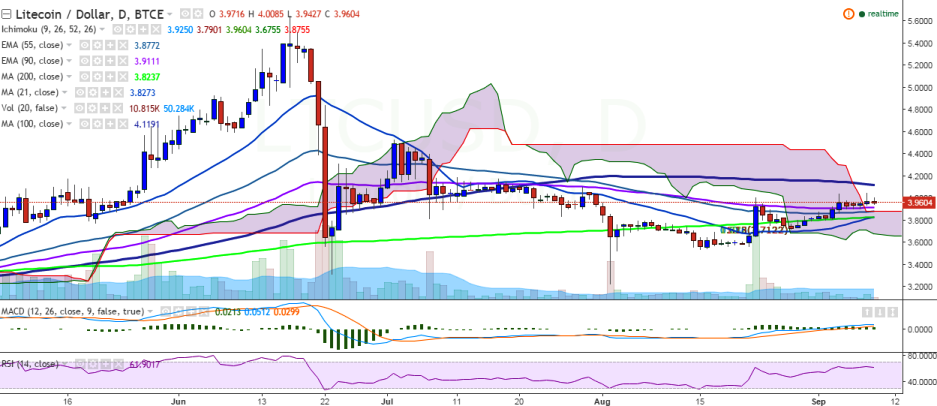
LTC/USD hit a fresh high of 4.05 levels on Thursday, but failed to hold its strength. It is currently trading at 3.96 levels (BTC-e).
Short-term trend: Bullish
Long-term trend: Bullish
Ichimoku analysis of daily chart:
Tenkan Sen: 3.91
Kijun Sen: 3.79
Trend reversal: 3.91 (90 EMA)
“LTC/USD is trying hard for a consistent break above 4.00 levels. Bullishness would be confirmed only above 100-day MA”, FxWirePro said in a statement.
The pair faces major resistance at 4.05 levels (September 08 high) and a break above would target 4.12 levels (100-day MA)/4.53 (July 02 high).
On the reverse side, support is seen at 3.91 (90 EMA) and a break below would target 3.82 (200-day MA)/ 3.63 (50% retracement of 3.22 and 4.05).