LTC/USD wakes up from limbo, close above 3.91 targets 4.05
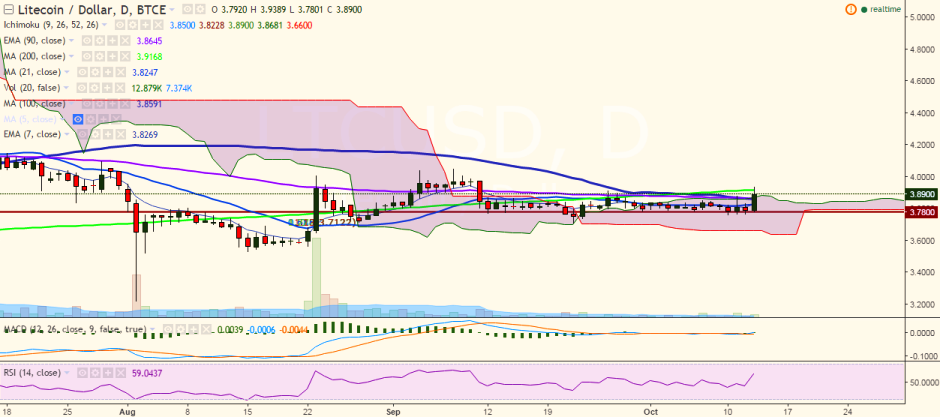
LTC/USD is trading strong on Thursday and broke above 200-DMA, hitting a high of 3.93 levels. It is currently trading at 3.90 levels (BTC-e). Ichimoku analysis of daily chart: Tenkan Sen: 3.82 Kijun Sen: 3.81 Trend rever…
LTC/USD is trading strong on Thursday and broke above 200-DMA, hitting a high of 3.93 levels. It is currently trading at 3.90 levels (BTC-e).
Ichimoku analysis of daily chart:
Tenkan Sen: 3.82
Kijun Sen: 3.81
Trend reversal: 3.86 (90 EMA)
“The pair is trading above 90 EMA at the time of writing and must close above this level for further upside. Bullishness in the pair could be confirmed only if it breaks above previous high of 4.05 levels”, FxWirePro said in a statement.
The pair faces immediate resistance at 3.91 (200-day MA) and a break above would target 4.05 (September 08 high)/4.17 (July 17 high).
On the downside, the pair has taken support near 3.78 levels and a break below would target 3.70 (September 22 low)/3.50 (psychological level).
The $0.131 mark was the late-September high; a revisit would depend on Bitcoin (BTC) strengthening and crypto-market sentiment improving. No timeframe was given.