


 Major Pair Action Bias: Extremely Bullish Surge Powers GBPUSD & NZDUSD as Bullish Momentum Ignites
  FxWirePro: EUR/AUD outlook weaker on renewed downside pressure
  FxWirePro- Woodies pivot (Major)
  FxWirePro: USD/JPY uptrend loses steam, remains on bullish path
  FxWirePro: GBP/USD advance after softer US inflation dims Fed rate hike bets
  Crypto Major Pair Action Bias: ETHUSD Bullish as BTCUSD, SOLUSD & XRPUSD Stay Neutral
  FxWirePro: NZD/USD trades in narrow range ,outlook bullish
  FxWirePro: GBP/NZD downtrend slows, but bearish sentiment remains
  AUDJPY Extremely Bullish Above 113: Strong AUD Fuels Fresh Rally – Buy Dips at 113 Targeting 115
  FxWirePro:EUR/NZD extends fall, key support lies ahead
  FxWirePro: EUR/AUD bears maintain upper hand
  FxWirePro: AUD/USD remains buoyant, looks to extend gains
  JPY Action Bias: Extremely Bullish Surge Ignites Across NZD, GBP & AUD
  FxWirePro- Major Pair levels and bias summary
  EUR/USD Holds Bullish Tone Despite Pullback from Yesterday’s High
  FxWirePro: GBP/NZD gains some upside momentum but still bearish


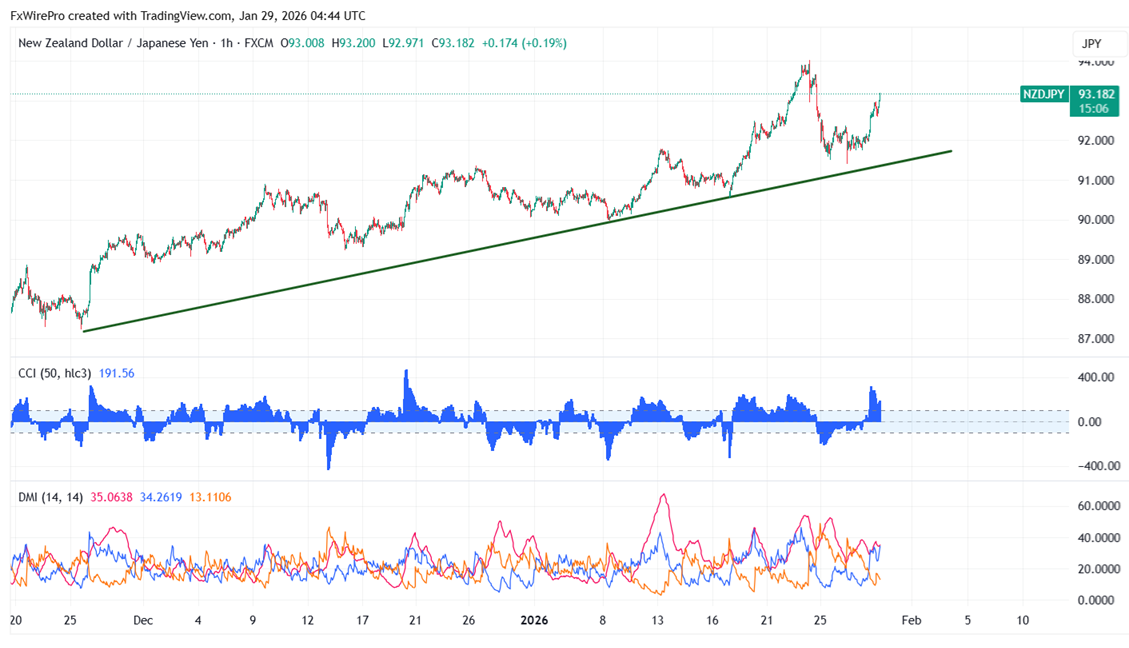
On board-based New Zealand dollar purchases, the NZDJPY saw a sharp rebound. Provided the 91.40 support level is held, the near-term trend seems to be favorable. The pair fell to 91.40 previously, but they are now trading around 93.09.
Oscillators and moving averages to forecast the trend of NZDJPY
CMP- 93.09
EMA (1-hour chart)
55-EMA- 92.17
200-EMA- 92.36
365-EMA- 91.81. The pair trades above the short (55 EMA) and long-term moving average 200 and above 365).
Major support- 92.50. Any breach below will drag the pair down to 92/91.40/90.85/90.45/89.70.
Major resistance - 93.67. Any break above 93.50 confirms minor bullishness, a jump to 94/95/96.
Indicator (1- hour chart)
CCI (50)- bullish
Average directional movement Index- Bullish. All indicators confirm a bullish trend.
It is good to buy on dips around 92.48-50 with SL around 91.40 for the TP of 95.


