


 FxWirePro: USD/JPY uptrend loses steam, remains on bullish path
  EUR/USD Holds Bullish Tone Despite Pullback from Yesterday’s High
  FxWirePro: GBP/USD hits one-month high, scope for further upside
  GBPJPY Bullish on Consolidation: Holds Above 216 After 218 Top – Buy Dips at 217 Targeting 220
  FxWirePro- Major Crypto levels and bias summary
  GBPUSD, AUDUSD & NZDUSD Turn Extremely Bullish: Strong Positive Momentum Drives Major Pair Action Bias
  FxWirePro:EUR/NZD extends fall, key support lies ahead
  Crypto Major Pair Action Bias: ETHUSD Bullish as BTCUSD, SOLUSD & XRPUSD Stay Neutral
  Major Pair Action Bias: Extremely Bullish Surge Powers GBPUSD & NZDUSD as Bullish Momentum Ignites
  FxWirePro: USD/CAD falls after BoC rate hold and weak U.S. producer inflation
  NZDJPY Extremely Bullish Above 94: Broad NZD Buying Fuels Fresh Upside – Buy Dips at 93.70 Targeting 95
  JPY Action Bias: Extremely Bullish Surge Ignites Across NZD, GBP & AUD
  FxWirePro :USD/JPY bulls loosen their grip a bit, dips to be bought
  FxWirePro: EUR/AUD outlook weaker on renewed downside pressure
  FxWirePro: GBP/NZD gains some upside momentum but still bearish


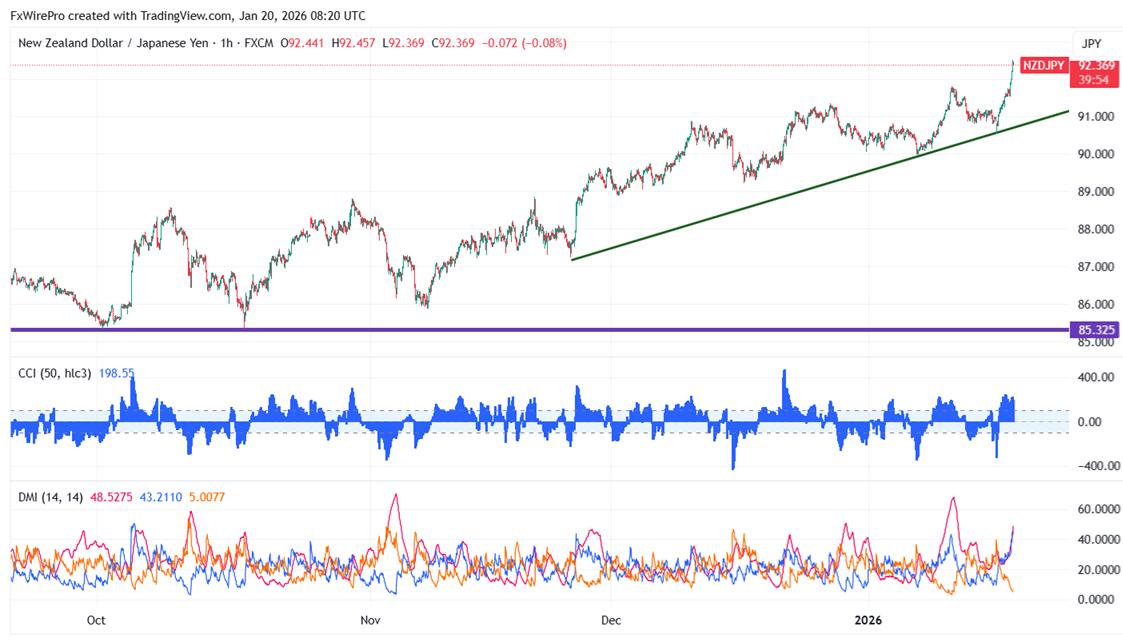
NZDJPY breaks significant resistance at 91.78 after a long consolidation. As long as support 91 holds, the intraday trend is upward. The pair topped highs of 91.79 yesterday; it presently trades around 91.49.
Oscillators and moving averages to forecast the trend of NZDJPY
CMP- 92.42
EMA (1-hour chart)
55-EMA- 91.47
200-EMA- 91.08
365-EMA- 90.86. The pair trades above the short (55 EMA) and above long-term moving average(200 and 365).
Major support- 92. Any breach below will drag the pair down to 91.74/91.28/90.85/90.45/89.70/89.20/88.70/88.40/87.99.
Major resistance - 92.50. Any break above 92.50 confirms minor bullishness, a jump to 93/93.67/95.
Indicator (4- hour chart)
CCI (50)- bullish
Average directional movement Index- Bullish. All indicators confirm a bullish trend.
It is good to buy on dips around 92.18-20 with SL around 91.40 for the TP of 93.67/94/95.


