


 FxWirePro: NZD/USD trades in narrow range ,outlook bullish
  Major Pair Action Bias: Extremely Bullish Surge Powers GBPUSD & NZDUSD as Bullish Momentum Ignites
  FxWirePro- Major Crypto levels and bias summary
  FxWirePro:EUR/NZD dips below lower range, bearish bias increases
  AUDJPY Extremely Bullish Above 113: Strong AUD Fuels Fresh Rally – Buy Dips at 113 Targeting 115
  Crypto Major Pair Action Bias: ETHUSD Bullish as BTCUSD, SOLUSD & XRPUSD Stay Neutral
  FxWirePro- Major Pair levels and bias summary
  FxWirePro: USD/JPY uptrend loses steam, remains on bullish path
  GBPJPY Bullish on Consolidation: Holds Above 216 After 218 Top – Buy Dips at 217 Targeting 220
  FxWirePro: USD/CAD falls after BoC rate hold and weak U.S. producer inflation
  NZDJPY Extremely Bullish Above 94: Broad NZD Buying Fuels Fresh Upside – Buy Dips at 93.70 Targeting 95
  FxWirePro :USD/JPY bulls loosen their grip a bit, dips to be bought
  FxWirePro: AUD/USD edges lower, but bullish outlook persists
  FxWirePro: GBP/NZD downtrend slows, but bearish sentiment remains
  FxWirePro: AUD/USD remains buoyant, looks to extend gains


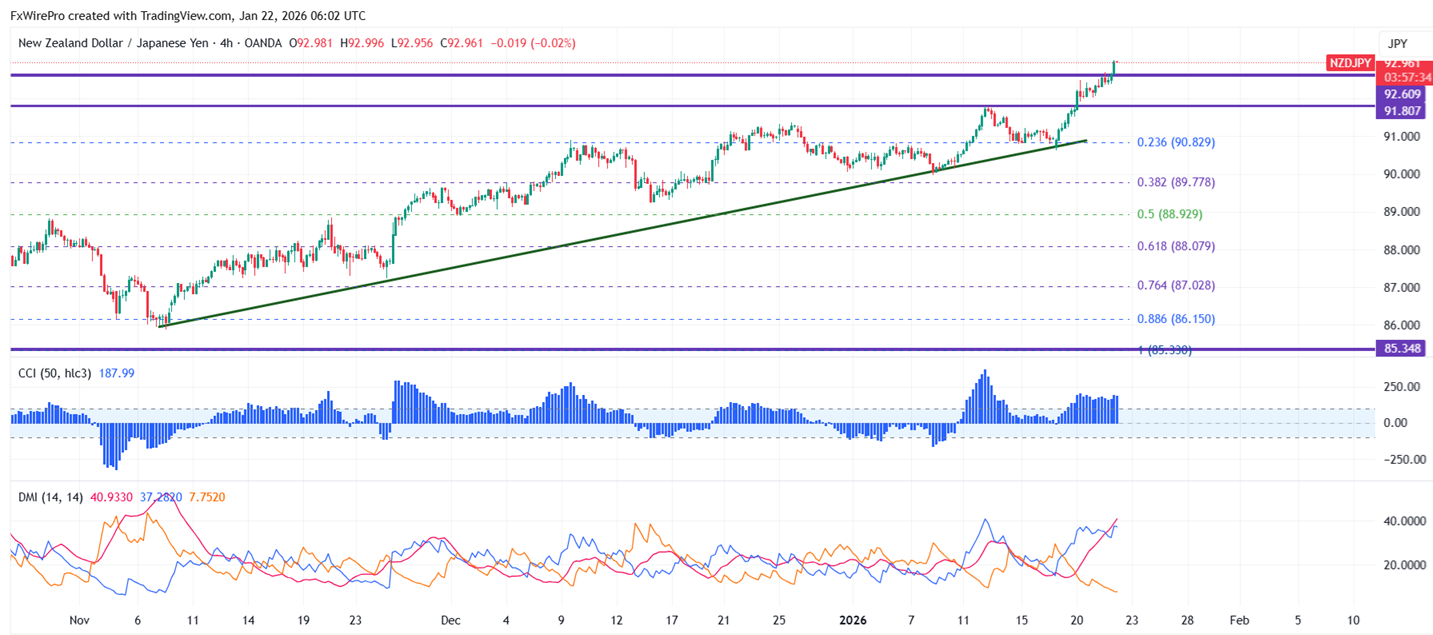
After the US abandoned the Greenland tariff, NZDJPY surged. The intraday trend is up as long as support 92 is maintained. At the time of writing, the pair topped highs of 93.01; it currently trades at 92.97.
Oscillators and moving averages to forecast the trend of NZDJPY
CMP- 92.979
EMA (4-hour chart)
55-EMA- 91.53
200-EMA- 90.54
365-EMA- 89.76. The pair trades above the short (55 EMA) and above long-term moving average(200 and 365).
Major support- 92.35. Any breach below will drag the pair down to 92/91.35/90.85/90.45/89.70/89.20/88.70/88.40/87.99.
Major resistance - 93.10. Any break above 93.10 confirms minor bullishness, a jump to 93.67/94/95.
Indicator (4- hour chart)
CCI (50)- bullish
Average directional movement Index- Bullish. All indicators confirm a bullish trend.
It is good to buy on dips around 92.38-40 with SL around 91.55 for the TP of 94/95.


