


 Crypto Major Pair Action Bias: ETHUSD Bullish as BTCUSD, SOLUSD & XRPUSD Stay Neutral
  JPY Action Bias: Extremely Bullish Surge Ignites Across NZD, GBP & AUD
  FxWirePro: NZD/USD trades in narrow range ,outlook bullish
  GBPJPY Bullish on Consolidation: Holds Above 216 After 218 Top – Buy Dips at 217 Targeting 220
  Major Pair Action Bias: Extremely Bullish Surge Powers GBPUSD & NZDUSD as Bullish Momentum Ignites
  GBPUSD, AUDUSD & NZDUSD Turn Extremely Bullish: Strong Positive Momentum Drives Major Pair Action Bias
  FxWirePro: AUD/USD edges lower, but bullish outlook persists
  FxWirePro :USD/JPY bulls loosen their grip a bit, dips to be bought
  EUR/USD Holds Bullish Tone Despite Pullback from Yesterday’s High
  FxWirePro: GBP/NZD gains some upside momentum but still bearish
  GBPJPY Bullish Surge: Strong Pound Ignites Fresh Upside on Fed-BOE Policy Divergence as All EMAs Align
  FxWirePro: GBP/USD hits one-month high, scope for further upside
  FxWirePro: USD/JPY uptrend loses steam, remains on bullish path
  NZDJPY Bullish Surge: Strong Kiwi Ignites Fresh Upside as 94 Support Holds and All EMAs Align
  FxWirePro- Major Crypto levels and bias summary
  ETH Stands Alone Bullish; BTC, SOL, XRP, BNB Neutral


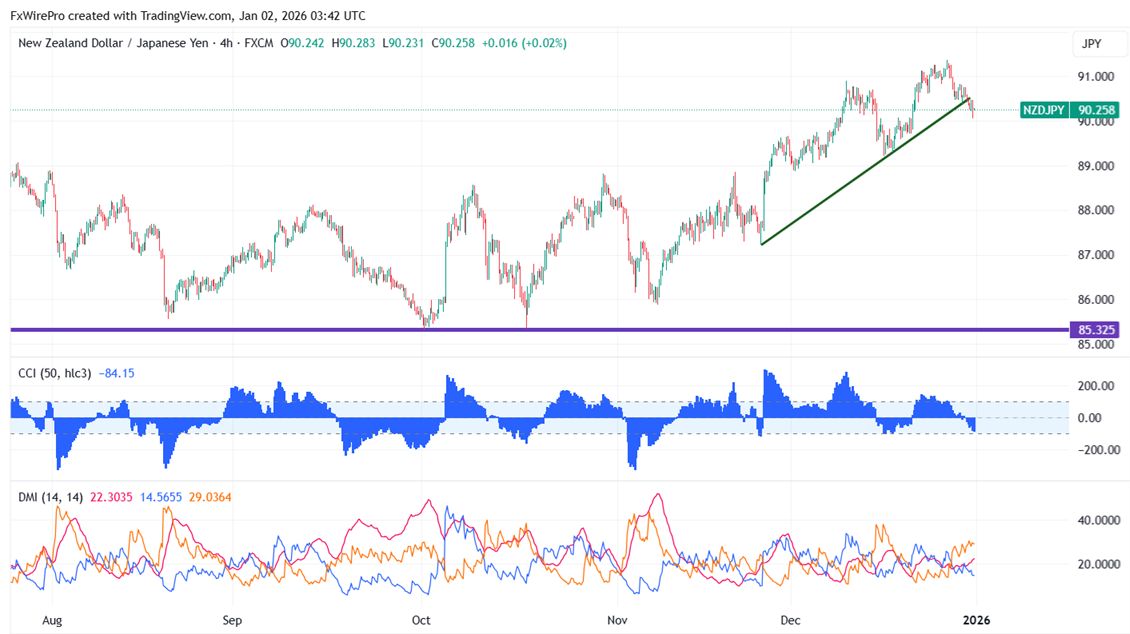
NZDJPY transactions are poor one month after a bullish trend. The intraday trend remains downward as long as the resistance at 91.50 remains intact. The pair reached an intraday low of 90.05; it is currently trading at nearly 90.258.
Oscillators and moving averages to forecast the trend of NZDJPY
CMP- 90.258
EMA (4-hour chart)
55-EMA- 90.55
200-EMA- 89.60
365-EMA- 88.89. The pair trades below the short (55 EMA) and long-term moving average(200 and 365).
Major support- 90. Any breach below will drag the pair down to 89.70/89.20/88.70/88.40/87.99.
Major resistance - 90.85. Any break above 90.85 confirms minor bullishness, a jump to 91.50/92/93.
Indicator (4- hour chart)
CCI (50)- bearish
Average directional movement Index- Neutral. All indicators confirm a mixed trend.
It is good to sell on rallies around 91 with SL around 91.50 for the TP of 89.20.


