


 Goldman Sachs Raises USD/JPY Forecast, Sees Yen Weakness Persist Through 2027
  JPMorgan Cuts Gold Price Forecast, Sees Bullion Reaching $4,500 by End of 2026
  Morgan Stanley Says China’s Reusable Rocket Progress Poses Long-Term Challenge to SpaceX
  Citi Raises TSMC Price Target as AI Chip Demand Strengthens Growth Outlook
  US Inflation Expected to Ease in June, but Fed Rate Hike Risks Persist Amid Middle East Tensions
  Bank of America Upgrades T-Mobile to Buy, Says LEO Satellite Fears Are Overdone
  Morgan Stanley Names Marks & Spencer Top European Retail Pick, Sees Strong Upside


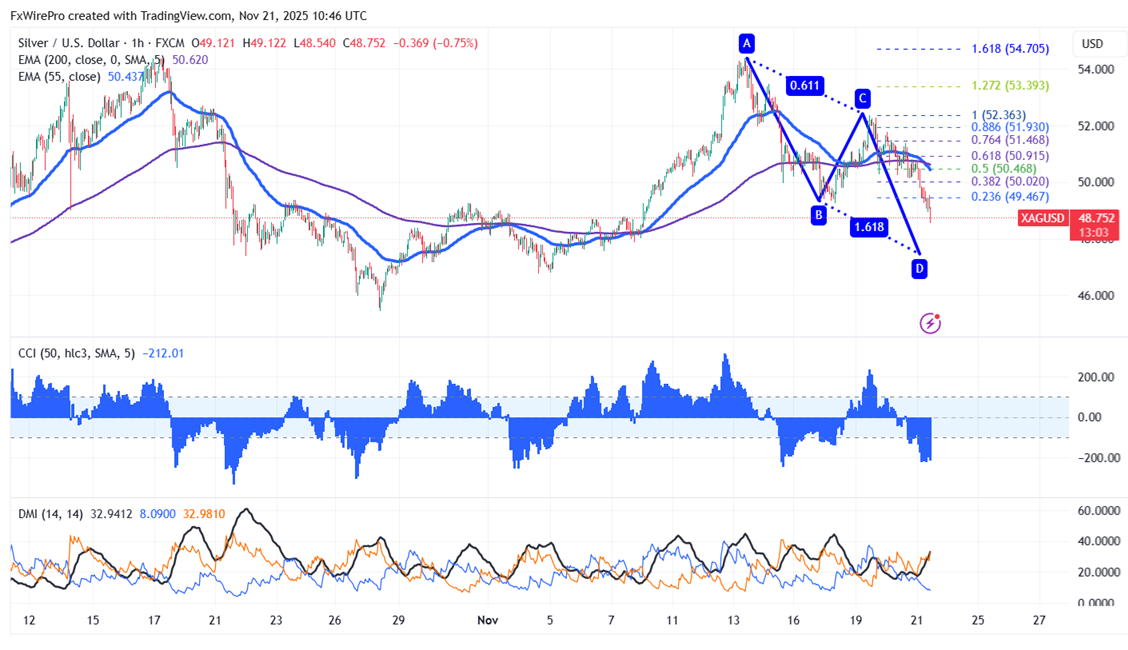
Silver Bulls Load Up: Bullish AB=CD Pattern Signals Sharp Rebound from $47.50 as Mixed US Jobs Data Slashes Fed Cut Bets
Chart pattern- Bullish AB=CD pattern
Potential Reversal Zone (PRZ)- $47.46
Silver declined sharply after hitting a multi-year high at $54.27. It hit an intraday low of $48.80 and is currently trading around $48.84.
September's long-overdue US jobs report offered a traditional mixed bag: nonfarm payrolls increased 119,000—more than double the anticipated 51,000—driven by strong hiring in healthcare and restaurants; however, the unemployment rate rose to 4.4%, its highest since October 2021, confirming a softening labor market. With October data still missing owing the government closure, the conflicting signals—strong job creation combined with increasing unemployment—have confused the December outlook of the Fed and lowered rate-cut probabilities to just 35–40%. Many experts have penciled in the next easing move for early 2026.
Trading Strategy and Key Levels for Silver
The commodity is trading below the short-term (34 and 55 EMA) and long-term moving average (200 EMA) in the 1-hour chart. The near-term support is around $48, and any violation below will drag the commodity to $47.45/$46.70/$45. The immediate resistance is at $49; any breach above targets $49.45/$50/$50.80/$51.26/$52.40.
It is good to buy on dips around $47.50-55 with a stop-loss at $46 for a TP of $52.


