


 Crypto Major Pair Action Bias: ETHUSD Bullish as BTCUSD, SOLUSD & XRPUSD Stay Neutral
  FxWirePro: AUD/USD edges lower, but bullish outlook persists
  FxWirePro: GBP/USD hits one-month high, scope for further upside
  FxWirePro: GBP/NZD gains some upside momentum but still bearish
  GBPJPY Bullish Surge: Strong Pound Ignites Fresh Upside on Fed-BOE Policy Divergence as All EMAs Align
  FxWirePro- Major Crypto levels and bias summary
  EUR/USD Holds Bullish Tone Despite Pullback from Yesterday’s High
  FxWirePro:EUR/NZD extends fall, key support lies ahead
  FxWirePro: EUR/AUD outlook weaker on renewed downside pressure
  GBPUSD, AUDUSD & NZDUSD Turn Extremely Bullish: Strong Positive Momentum Drives Major Pair Action Bias
  FxWirePro: NZD/USD steadies around 0.5830,retains bid tone
  FxWirePro: USD/JPY uptrend loses steam, remains on bullish path
  FxWirePro: USD/CAD falls after BoC rate hold and weak U.S. producer inflation
  JPY Action Bias: Extremely Bullish Surge Ignites Across NZD, GBP & AUD
  FxWirePro- Woodies pivot (Major)


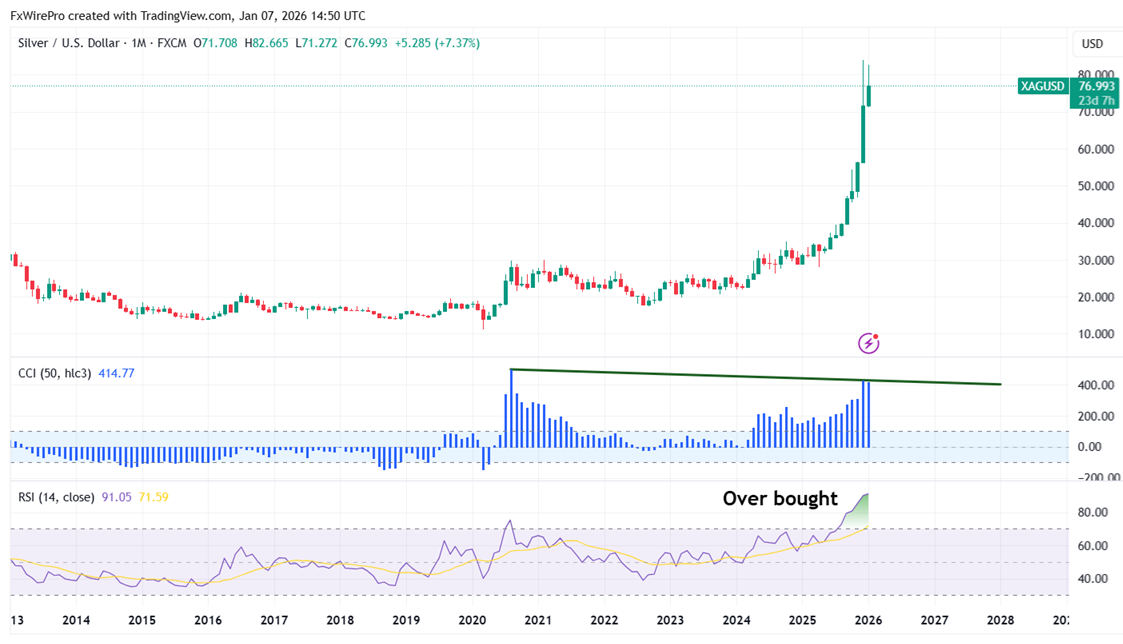
Monthly RSI- 91 (Overbought)
Bearish divergence - CCI(50)- Monthly chart
Silver lost most of its gains following a great jump of more than $12 from a temporary bottom $70.38. It hit an intraday peak of $82.66 and is now trading around $77.19.
Trading Strategy and Key Levels for Silver
On the monthly chart, Silver is trading over long-term moving averages (200 and 365- EMA) and short-term (34 and 55 EMA). In the monthly chart, RSI is trading above 90, which points to extremely overbought circumstances and suggests it is better to wait for a significant drop for reentry. The near-term support is about $76.40, and any breach below will draw the commodity to $75.20/$74.20/$71.90/$70/$68.30/$65.98/$62/$58.62. The first resistance is at $78; any breach above targets $80/$82.65/$83.59/$87.90/$90.
It is good to sell on rallies around $78 with a stop-loss at $82.50 for a TP of $70.05/$62.


