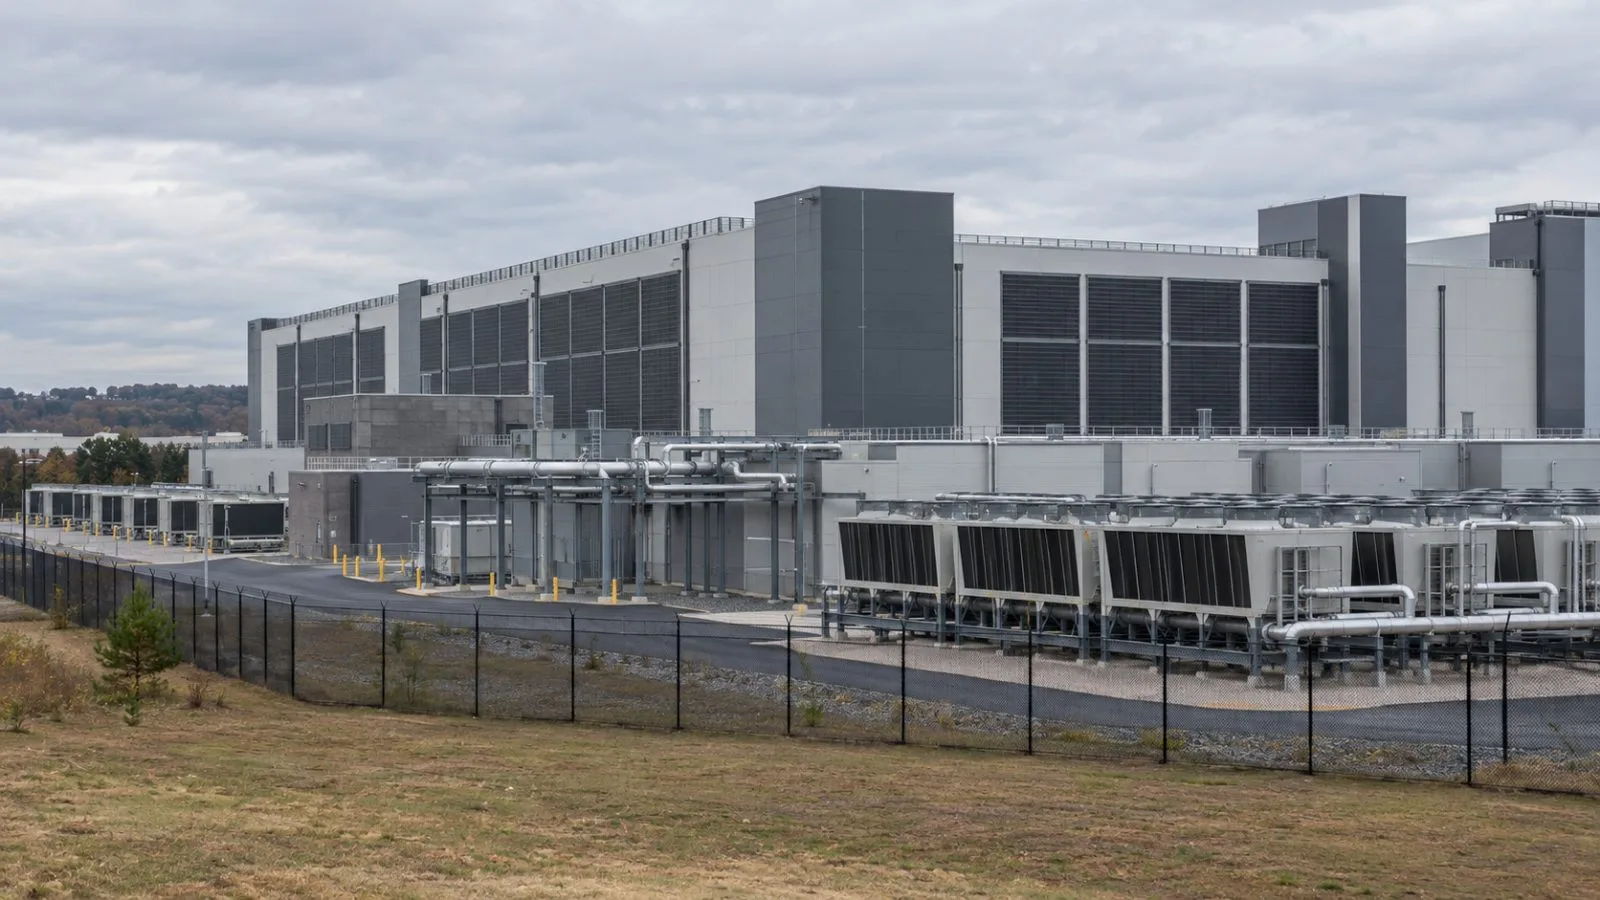
Researchers compared the locations of 9,347 data centers with historical water models and found about one-quarter in regions with at least one monthly shortfall, highlighting the facilities’ overlap with water supplies shared by other users.
Published in Environmental Science & Technology, the study used conditions from 2001 through 2010. It classified a region as having a gap when modeled demand exceeded renewable water supply during a month. The researchers counted 523 centers in regions where that gap appeared for nine to 12 months per year.
The United States had 3,619 of the mapped centers, or 39% of the total. About 21% of U.S. locations were in regions with at least one modeled monthly gap. Municipal demand was the leading water use in regions containing 41% of the facilities; irrigation led in regions containing another 28%.
Those figures describe regional conditions. The study did not calculate individual data centers’ water withdrawals or determine whether a facility contributed to a local shortfall. Its 2001–2010 baseline also does not assess water availability at those sites today.
The researchers describe the modeled gaps as an upper-bound estimate because the analysis does not explicitly include measures such as water transfers, desalination or reservoir operations. They identify ongoing cooling demand and locally constrained supplies as sources of pressure. The study says other users in a basin may face greater risk than data center operators, which often have the means to secure water, but it does not establish that this occurred at the mapped sites.
In a warming scenario, global temperatures rise to three degrees Celsius above the 1850–1900 preindustrial average. With the current facility locations unchanged, the share in regions with at least one monthly gap increases to 33% worldwide and 35% in the United States. The scenario assesses the existing footprint and does not estimate where future centers might be built.