


 FxWirePro- Major Pair levels and bias summary
  FxWirePro: USD/CAD loses momentum but bullish setup remains
  FxWirePro- Major Crypto levels and bias summary
  EURJPY Consolidates Above Key EMAs: Mixed Indicators Suggest Cautious Optimism for Traders
  FxWirePro: AUD/USD holds narrow range, focus on near-term support
  FxWirePro- Major Crypto levels and bias summary
  GBPJPY Caught in a Tight Range: Bearish EMAs Suggest a Breakout Awaits
  AUDJPY Trapped in Narrow Range: Bearish Technicals Suggest Downside Risk
  FxWirePro: NZD/USD holds narrow range, scope for downward resumption
  FxWirePro: GBP/USD neutral in the near-term, scope for downward resumption
  FxWirePro: EUR/ NZD gaining momentum for a move towards 2.0350 level
  FxWirePro: NZD/USD extends losing run, eyes 0.5600 level
  GBPJPY Surges Past Trendline Resistance, Signaling Bullish Momentum
  FxWirePro- Major Pair levels and bias summary
  FxWirePro: USD/JPY steadies below 162.00 as Geopolitical risks keep dollar supported
  FxWirePro: USD/ZAR retreats slightly but trend is still bullish


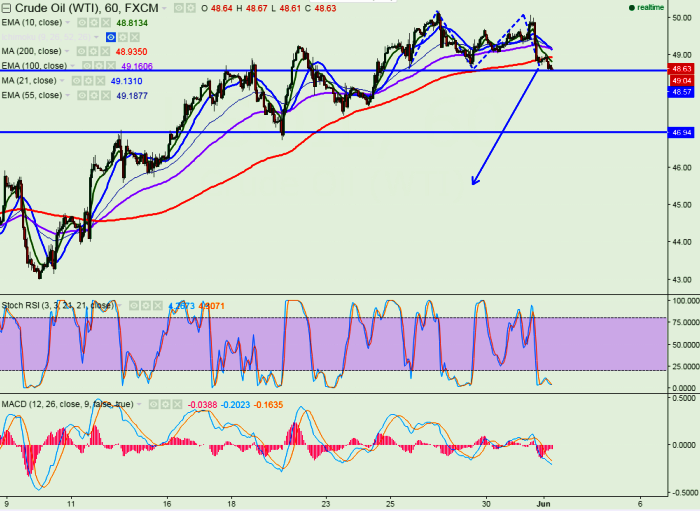
- Pattern Formed -M- shaped pattern
- Major support $48.60
- US oil has jumped till $50.08 yesterday but not able break above $50.18 high made on May 26th 2016.
- The recent rally in WTI crude was fuelled by militants attacks on pipelines and oil infrastructure in the southern Niger delta have crippled the production in Nigeria.
- Exports have expected to dropped to 990000 barrels per day from 2.2 million barrels per day .
- Crude oil prices is expected to show a technical correction in coming days as OPEC meeting and Fed rate hike looms.
- Technically any break below $48.60 will drag the US oil till $46.60/$45 in short term.
- On the higher side it should break above $50.18 for further bullishness. Any indicative break above targets $50.90/$51.50.
It is good to sell below $48.60 with SL around $50.10 for the TP of $46.55/$45


