
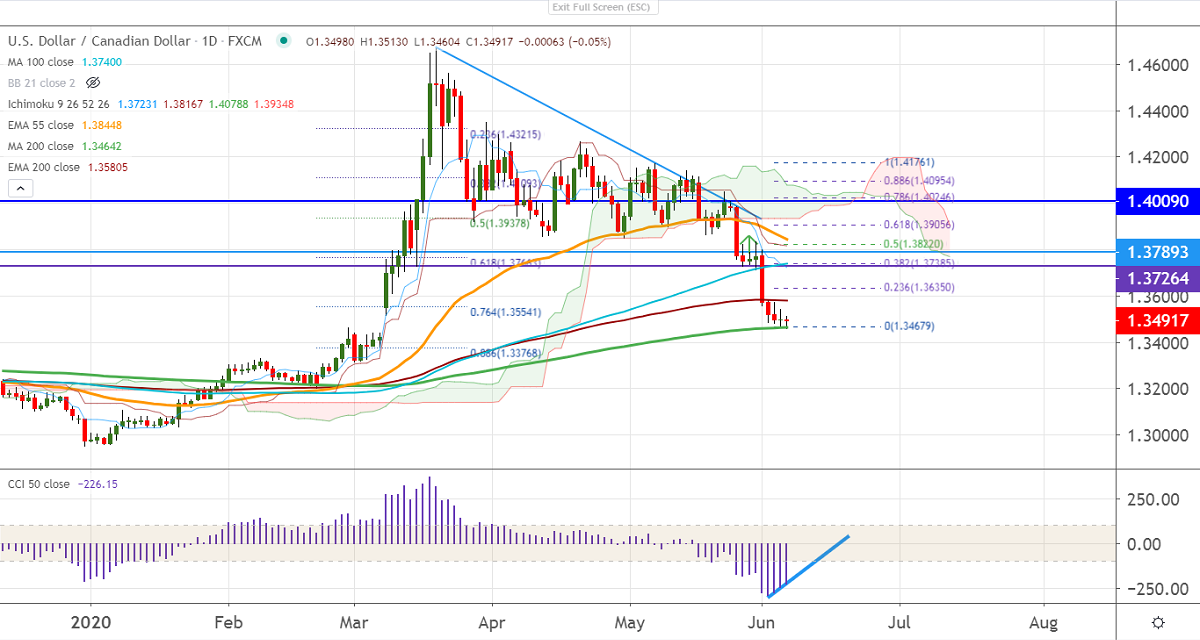
Ichimoku analysis (Daily chart)
Tenken-Sen- 1.37370
Kijun-Sen- 1.3820
USDCAD was one of the worst performers and lost more than 700 pips in one month. The decline was mainly due to broad-based US dollar selling on dismal economic data and slight bullish in crude oil. The Bank of Canada has kept its rates unchanged at 0.25% and said that the economy has avoided its "most severe scenario". It hits a low of 1.34600 and is currently trading around 1.34935.
WTI Crude oil continues to trade for the 6th consecutive week and holding well above 21-W MA. A jump till $43.50 is likely.
Technically, significant support stands at 1.3460 (200- day MA), and any violation below targets 1.3400/1.3372. The near term resistance is at 1.3540, an indicative break beyond will take the pair to the next level till 1.3585/1.3635 (38.2% fib).
It is good to buy on dips around 1.3468-70 with SL around 1.3435 for the TP of 1.3585.


