


 Gold Prices Fall Amid Rate Jitters; Copper Steady as China Stimulus Eyed
  FxWirePro: Daily Commodity Tracker - 21st March, 2022


2017’s rally in the U.S. stocks is continuing well into 2018. However, some signs are emerging which suggests that stock is becoming overvalued and a correction looks increasingly likely. In 2017, the U.S. benchmark stock index returned more than 19 percent and in 2018, they have returned 2.9 percent so far, which is quite remarkable. While the latest increase is being supported by the recent changes in the U.S. tax code, several indicators are strongly suggesting stock overvaluation despite the tax euphoria.
Previously we discussed, that as of latest data, U.S. dividend yield has declined to 1.75 percent, the lowest level in more than a decade, while the recent rate hikes by the U.S. Federal Reserve has pushed the short-term rate (both1-year and 2-year) above the dividend yield. As of today, the U.S. 1-year treasury is returning about 1.78 percent, while the 2-year treasury is returning about 1.97 percent.
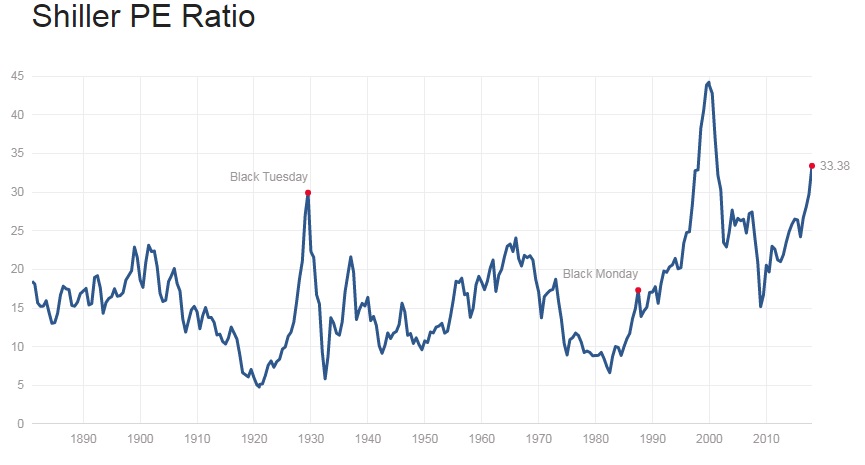
The above chart is yet another indication that stocks are anything but cheap. The chart shows Shiller PE Ratio by Nobel laureate Robert Shiller, which is a Price earnings ratio based on average inflation-adjusted earnings from the previous 10 years. It is currently at 33.38, which is the highest value, only second to the dotcom bubble of late the late 90’s.


