


 FxWirePro- Major Crypto levels and bias summary
  Ethereum Cracks Under $1,700: Sell the Rally Near $1,750 as Bears Eye $1,380–$1,200


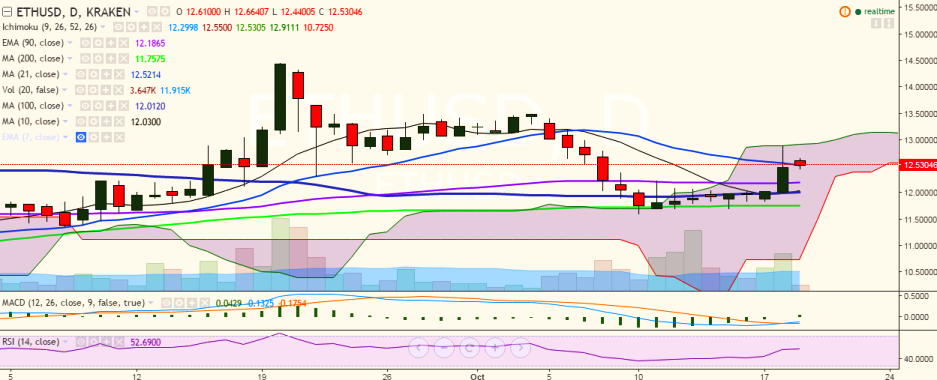
ETH/USD is showing a slight dip after hitting 12.89 levels on October 18. It is currently trading at 12.50 levels (Kraken).
Ichimoku analysis of daily chart:
Tenkan Sen: 12.24
Kijun Sen: 12.55
Trend reversal: 12.17 (90 EMA)
The pair failed to close above 12.55 levels (21-day MA) on Tuesday and is currently trading in the red and hovering around this level. The short-term trend appears bullish for the pair and a consistent break above 21-day MA would target 12.89 levels. Further strength would see it testing 13.50 (October 04 high).
On the flipside, support is seen at 12.17 (90 EMA) and any violation would drag the pair to 11.99 (100-day MA)/11.75 (200-day MA).

- News

- Economy

- Central Banks
- Investing
- Research
- Roundups
- Digital Currency
- Insights
- Technical Analysis
- Technology
- Business
- Law
- Health
- Nature
- Fintech
- Science
- Topic
- Opinions
- ©Econometrics LLC . All Rights Reserved.
ETH/USD hovers around 21-DMA, close above targets 12.89
Wednesday, October 19, 2016 11:32 AM UTC
Editor's Picks


- Market Data
Most Popular


