


 FxWirePro- Major Crypto levels and bias summary


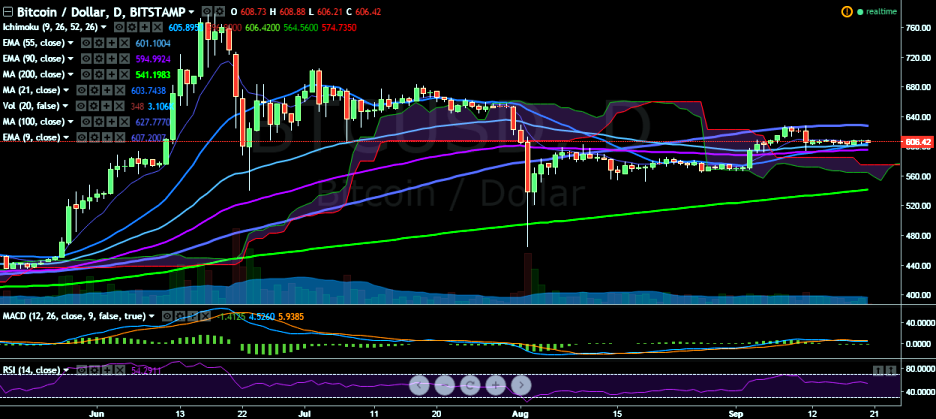
BTC/USD continues to trade flat on Tuesday and has slipped below the 9-EMA. It is currently trading at 606 levels at the time of writing (Bitstamp).
Long-term trend: Bullish
Ichimoku analysis of daily chart:
Tenkan Sen: 611.81
Kijun Sen: 596.90
Trend reversal: 594.73 (90 EMA)
On the upside, the pair is facing minor resistance around 610 levels and should break above this levels for further upside. It will run into major resistance at 628.43 (100-day) and a break above would target 653.69 (78.6% retracement of 704.99 and 465.28)/ 705 (July 3 high).
On the reverse side, the pair has taken support near 600 levels (55 EMA) and is trading above that level. A break below will further weaken it to 594.73 (90 EMA)/ 547.14 (50% retracement of 465.28 and 628.99)/ 540.20 (200-day MA).

- News

- Economy

- Central Banks
- Investing
- Research
- Roundups
- Digital Currency
- Insights
- Technical Analysis
- Technology
- Business
- Law
- Health
- Nature
- Fintech
- Science
- Topic
- Opinions
- ©Econometrics LLC . All Rights Reserved.
BTC/USD faces resistance at 610, break above targets 628
Tuesday, September 20, 2016 7:30 AM UTC
Editor's Picks


- Market Data
Most Popular


8


