


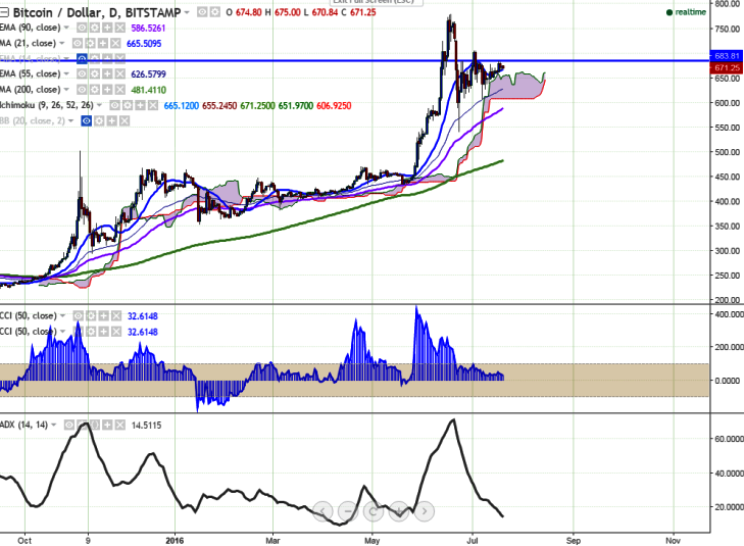
BTC/USD continues trading above 21 MA on Wednesday. It currently trades at 671.41 levels at the time of writing (Bitstamp).
Ichimoku analysis of daily chart:
Tenkan Sen: 661.75
Kijun Sen: 655.24
Trend reversal: 584.62 (90 EMA)
The pair has taken support near 55 EMA and hit 684.19 levels on July 17. Since then the pair is trading weak. However, both short- and long-term trend appear bullish. BTC/USD faces major resistance at 684.19 levels (July 17 high) and a break above would take the pair to 705 levels (July 3 high)/732 (127.2% retracement of 704.99 and 605.50).
On the flipside, support is seen at 635.38 (61.8% retracement of 605.50 and 684.19) and a break below would drag the pair to 605.50 (July 7 low)/ 584.62 (90 EMA).

- News

- Economy

- Central Banks
- Investing
- Research
- Roundups
- Digital Currency
- Insights
- Technical Analysis
- Technology
- Business
- Law
- Health
- Nature
- Fintech
- Science
- Topic
- Opinions
- ©Econometrics LLC . All Rights Reserved.
BTC/USD trades above 21 MA, eyes 685 levels
Wednesday, July 20, 2016 7:36 AM UTC
Editor's Picks


- Market Data
Most Popular


