


 FxWirePro- Major Crypto levels and bias summary


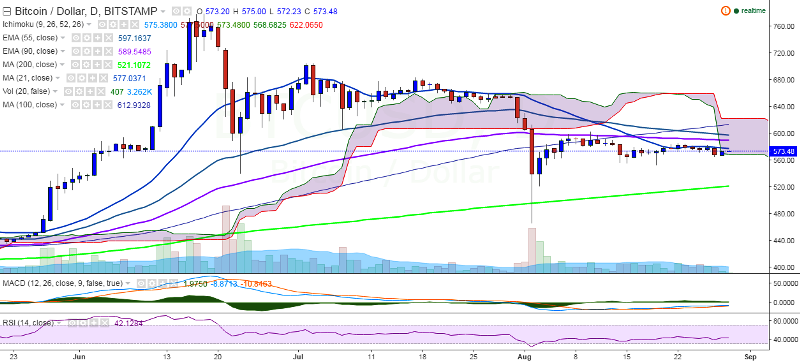
BTC/USD is trading weak, with its upside capped by 21-day MA. It is currently trading at 572.80 levels at the time of writing (Bitstamp).
Ichimoku analysis of daily chart:
Tenkan Sen: 569.12
Kijun Sen: 539.15
Trend reversal: 590.28 (90 EMA)
“The pair has failed to close above 21-day MA in the last couple of days. It should close above 600.00 levels for strong bullish trend”, FxWirePro said in a statement.
On the upside, major resistance is seen at 590.28 (90 EMA) and a break above would target 611 (100-day MA)/ 634 (161.8% retracement of 603 and 522.30).
On the other hand, support is likely to be found at 550 (psychological level) and any weakness would target 520 (200-day MA)/465.28 (August 2 low).

- News

- Economy

- Central Banks
- Investing
- Research
- Roundups
- Digital Currency
- Insights
- Technical Analysis
- Technology
- Business
- Law
- Health
- Nature
- Fintech
- Science
- Topic
- Opinions
- ©Econometrics LLC . All Rights Reserved.
BTC/USD upside capped by 21-day MA, break above 600 confirms bullishness
Monday, August 29, 2016 7:35 AM UTC
Editor's Picks


- Market Data
Most Popular


