


 FxWirePro- Major Crypto levels and bias summary
  USDCHF Fades Post-Jobs Rally: Bears Eye 0.7500 – Sell the Bounce at 0.7730
  FxWirePro: GBP/AUD extends drop, faces 23.6%fib support
  Ethereum’s $1907 Bounce Wilts – Sell the $2048–2050 Rally for $1500
  FxWirePro: GBP/USD retreats slightly but trend is still bullish
  FxWirePro- Major Pair levels and bias summary
  FxWirePro- Major Crypto levels and bias summary
  GBPJPY in Freefall – Bearish Breakdown Fuels Sell-on-Rallies Setup
  FxWirePro- Major European Indices
  FxWirePro: USD/ CNY outlook weaker on renewed downside pressure
  Yen Roars Back: EURJPY Cracks Below 183 – Bears Target 180 on Rallies


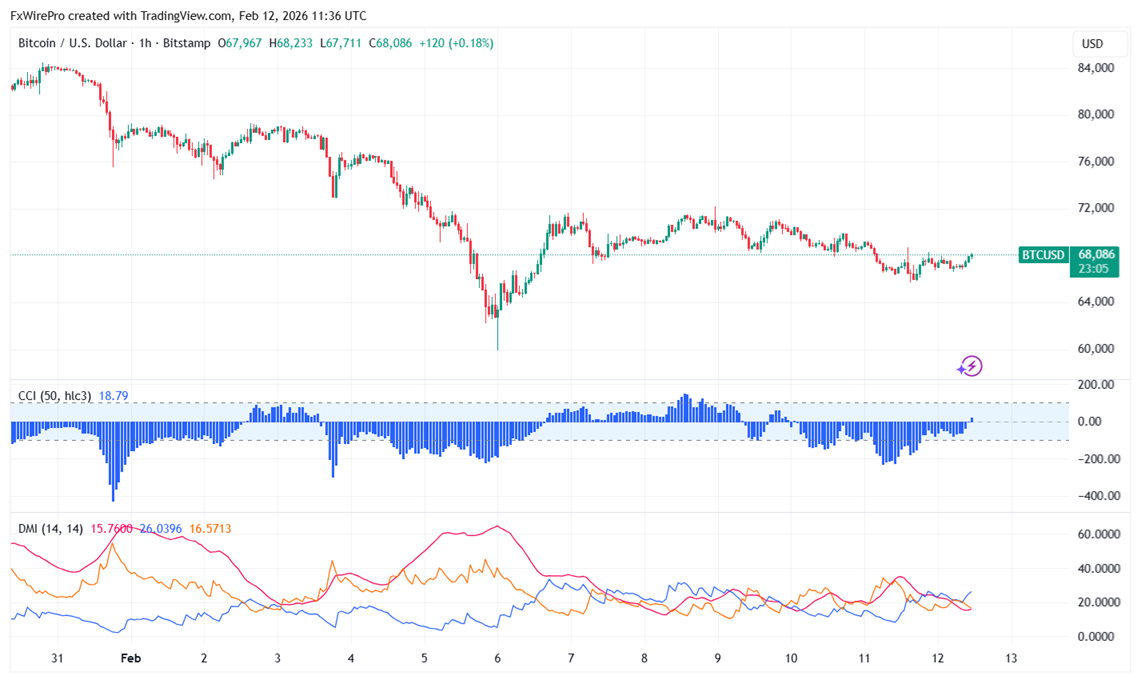
BTCUSD showed a minor pullback from the temporary bottom of $65720 made yesterday. It hits an intraday high of $68233 and is currently trading around $68019.
|
Technicals |
CMP -$68015 |
Trend |
|
|
1- Hour chart |
Value |
|
|
|
55 EMA |
$67895 |
CMP > 55 EMA |
Bullish |
|
200- EMA |
$70564 |
CMP is less than 2200- EMA |
Bearish |
|
365- EMA |
$74252 |
CMP < Value |
Bearish |
In the 4- hour chart, the pair is trading well below short term - $71057 (55-EMA) and long-term- $84992 (365- EMA) and $80396 (200-EMA).
Major support- $64000/$60000/$52500/$50000. Minor bullishness only above $72500.
|
Momentum indicator (1-hour chart) |
Inference |
Value |
|
CCI(50) |
Neutral |
|
|
ADX |
Bullish |
Strength - 15.84. It should cross above 20 level for bullish trend confirmation |
It is good to sell on rallies around $70000 with SL around $74250 for a TP of $60000.


