


 Ethereum Reclaims $2,000 Handle: ETHUSD Stabilizes as Bulls Eye a Recovery
  Bitcoin Recovers Amid Easing Geopolitics: Bulls Target USD 80,000 Support Rebound
  FxWirePro- Major Pair levels and bias summary
  FxWirePro: USD/ZAR sustains gains as uptrend remains strong
  FxWirePro: GBP/USD recovers but bears are not done yet again
  Pound Under Pressure as Yen Stabilizes: GBPJPY Bears Target 208 as Key EMAs Hold Resistance
  FxWirePro: EUR/AUD eases slightly but trend is still bullish
  FxWirePro: USD/CNY gains some ground but bearish outlook persists
  FxWirePro: GBP/NZD range to extend until there is game changing news
  FxWirePro: USD/ZAR fibo rejection triggers sizeable pullback
  Bitcoin Battles Volatility: Institutional Support Eyes USD 64,000 Floor Amid Geopolitical Tensions
  FxWirePro: USD/JPY firms as Trump's address on Gulf war spark fresh concerns


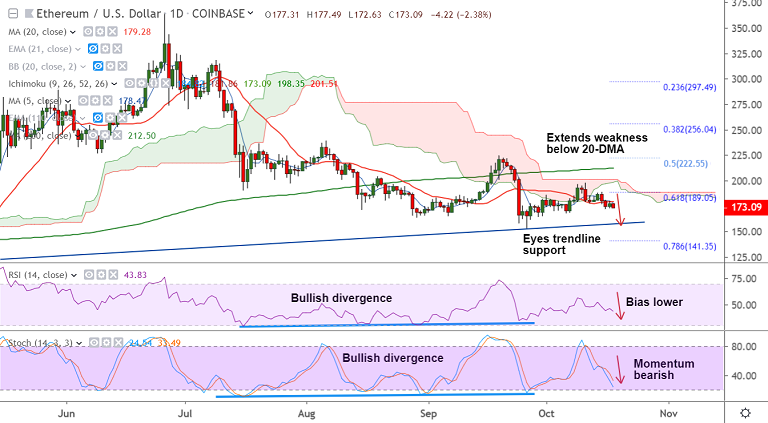
ETH/USD chart - Trading View
Exchange - Coinbase
Support: 167.50 (Oct 6 low); Resistance: 179 (converged 5 and 20 DMAs)
Technical Analysis: Bias Bearish
ETH/USD struggles to extend recovery above 179 mark, bias remains bearish.
The pair is extending weakness on the day, following slump in Bitcoin prices.
ETH/USD was trading 2.22% lower on the day at 173.46 after closing 1.61% higher on Thursday's trade.
Price action is extending weakness below 20-DMA support and is now on track to test Oct 6th lows at 167.50.
Major and minor trend are bearish as indicated by GMMA indicator. Break below 167.50 will see test of trendline support at 158 level.
Volatility is low. Bullish divergence could limit downside.
Also Stochastics oscillator on weekly charts has approached oversold zone.
Retrace above strong resistance at 179 (nearly converged 5 and 20 DMAs) to see more gains. Bearish invalidation only above 200-DMA.


